Question
1.On Sheet1 in this file, in the Summary Analysis section, enter XLOOKUP functions to determine Net Sales, Gross Profit, Net Earnings and % Earnings based
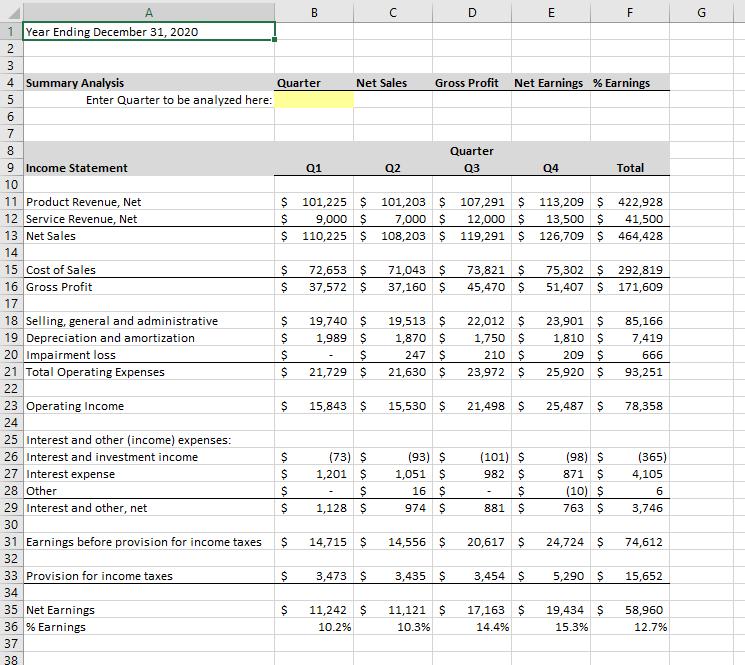
1.On Sheet1 in this file, in the Summary Analysis section, enter XLOOKUP functions to determine Net Sales, Gross Profit, Net Earnings and % Earnings based on the input to be entered in the Quarter cell (highlighted yellow).- Enter and display the results for the third quarter.
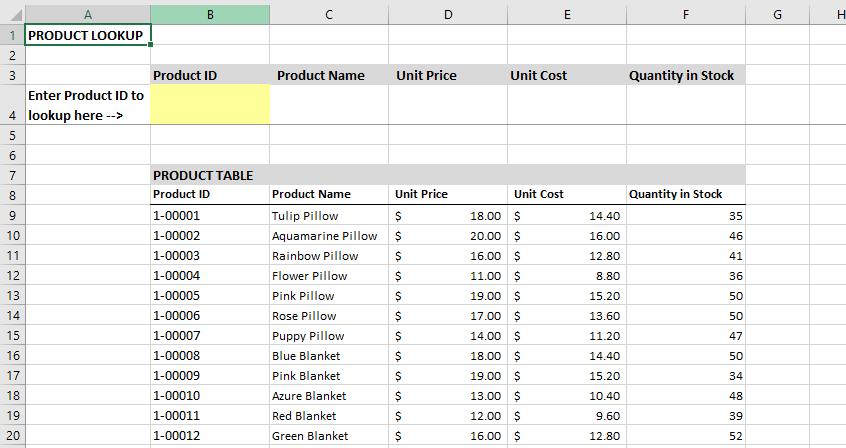
- Update cell formatting so formula results are displayed properly (leave yellow highlighting on input cell).2.On Sheet2 in this file, enter XLOOKUP functions to complete the Product Lookup section based on the input to be entered in the Product ID cell (highlighted yellow).- Enter and display results for Product ID 1-00027.
- Update cell formatting so formula results are displayed properly (leave yellow highlighting on input cell).


A 1 Year Ending December 31, 2020 1234SGR 00 o 4 Summary Analysis 5 6 7 8 Enter Quarter to be analyzed here: 9 Income Statement 10 11 Product Revenue, Net 12 Service Revenue, Net 13 Net Sales 14 15 Cost of Sales 16 Gross Profit 17 18 Selling, general and administrative 19 Depreciation and amortization 20 Impairment loss 21 Total Operating Expenses 22 23 Operating Income 24 25 Interest and other (income) expenses: 26 Interest and investment income 27 Interest expense 28 Other 29 Interest and other, net 30 31 Earnings before provision for income taxes 32 33 Provision for income taxes 34 35 Net Earnings 36 % Earnings 37 38 Quarter $ SSS $ $ is s $ $ isis is i $ $ S $ $ SSS $ $ is $ B 10 S Q1 Net Sales 72,653 $ 37,572 $ 19,740 $ 1,989 $ $ 21,729 $ 101,225 $ 101,203 $ 9,000 $ 7,000 $ 110,225 $ 108,203 $ 15,843 $ (73) $ 1,201 $ $ 1,128 $ $ 3,473 $ 11,242 $ 10.2% U 14,715 $ Q2 Gross Profit 71,043 $ 37,160 $ 19,513 $ 1,870 $ 247 $ 21,630 $ 15,530 $ (93) $ 1,051 $ 16 $ 974 $ 14,556 $ 3,435 $ D 11,121 $ 10.3% Quarter Q3 Net Earnings % Earnings 73,821 $ 45,470 $ 22,012 $ 1,750 $ 210 $ 23,972 $ 21,498 $ (101) $ 982 107,291 $ 113,209 $ 422,928 12,000 $ 13,500 $ 41,500 119,291 $ 126,709 $ 464,428 $ $ 881 $ 20,617 $ E 3,454 $ 17,163 $ 14.4% Q4 23,901 $ 1,810 $ 209 $ 25,920 $ 75,302 $ 292,819 51,407 $ 171,609 25,487 $ (98) $ 871 $ (10) $ 763 $ F 24,724 $ 5,290 $ Total 19,434 $ 15.3% 85,166 7,419 666 93,251 78,358 (365) 4,105 6 3,746 74,612 15,652 58,960 12.7% G
Step by Step Solution
3.43 Rating (159 Votes )
There are 3 Steps involved in it
Step: 1
Summary Analysis Quarter Net Sales Gross Profit Net Earnings Earnings Q3 107291 71043 1...
Get Instant Access to Expert-Tailored Solutions
See step-by-step solutions with expert insights and AI powered tools for academic success
Step: 2

Step: 3

Ace Your Homework with AI
Get the answers you need in no time with our AI-driven, step-by-step assistance
Get Started


