

Answered step by step
Verified Expert Solution
Question
1 Approved Answer
1The classification by year of study of a student (freshman, sophomore, junior, senior) is an example of: a a categorical variable B a discrete variable
1The classification by year of study of a student (freshman, sophomore, junior, senior) is an example of:
a a categorical variable
B a discrete variable
C a continuous variable
D a series of random numbers
2 Possible answers to the question: "How many people live in your household?" Are an example ofA a categorical variableB None of the aboveC a discrete variableD a continuous variable
3 The Campus Security Office is conducting a survey of the number of students in a section of the parking lot every 30 minutes in a 24-hour period. The purpose is to determine the route in the security patrol in that section of the parking lot, and thus serve as many students as possible. If X is the number of students in the parking lot each time period, then X is an example of a variable:A keep going.B discreet.C categorical.D statistics. 4Possible answers to the question: "What is your annual income?" Are an example of a variable ofA interval scaleB nominal scaleC ratio scaleD ordinal scale 5The answer to the question "What is your favorite color?" is an example of an ordinal scaled variable.A TrueB False 6The answer to the question "How satisfied are you with your statistics course?" It is an example of an ordinal scale variable.A FalseB True
7The answer to the question "How many hours on average do you watch television during the week?" is an example of a ratio scale variable.A TrueB False 8The amount of coffee consumed by an individual in a day is an example of a discrete variable.A FalseB True 9The width of each bar in a histogram corresponds to:A the differences between the class boundaries B the midpoint of each classC the number of observations in each classD the percentage of observations in each class 10According to BBC News, Country X is experiencing growth in births. The number of live births has increased for the fifth year in a row. Which of the following is the best way to present this information?A A plot of serial dataB A table of 2 variablesC A histogramD A Pareto chart 11The answers to two categorical questions can be presented usingA. A contingency tableB A cumulative frequency distribution tableC. A scatter plotD A warhead
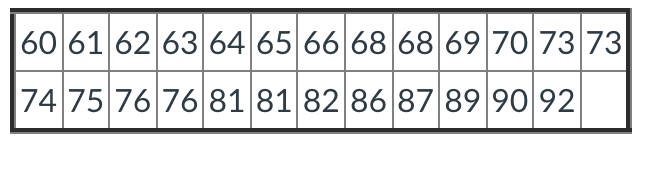
12 The issue of health is gaining importance in both academic and political affairs. Recently, a sociological researcher conducted a study on people over 60, who do not qualify for the Medicaid health program because their income is very high. The ages of the 25 study participants are presented in the following table.
Step by Step Solution
There are 3 Steps involved in it
Step: 1

Get Instant Access to Expert-Tailored Solutions
See step-by-step solutions with expert insights and AI powered tools for academic success
Step: 2

Step: 3
Ace Your Homework with AI
Get the answers you need in no time with our AI-driven, step-by-step assistance
Get Started
Algebra And Trigonometry
Authors: Cynthia Y Young
3rd Edition
1118475755, 9781118475751