

Question
1)The following data relate to the number of items produced per shift followed normal distribution by two workers Rahul and Ramesh for a number of
1)The following data relate to the number of items produced per shift followed normal distribution by two workers Rahul and Ramesh for a number of days:

Can it be inferred that Rahul is more stable worker compared to Ramesh by testing the variation in the item produced by them at 5% level of significance.
2)In a locality, 100 persons were randomly selected and asked about their educational achievements. The results were as follows:
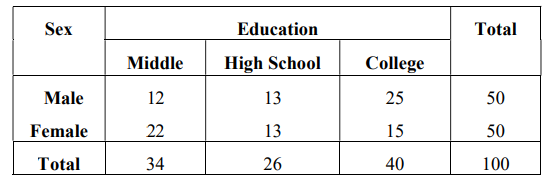
Can we say that education depends on sex at 5% level of significance?
\begin{tabular}{|c|c|l|l|l|l|l|l|l|l|l|} \hline Rahul & 19 & 22 & 24 & 27 & 24 & 18 & 20 & 19 & 25 & \\ \hline Ramesh & 26 & 37 & 40 & 35 & 30 & 40 & 26 & 30 & 35 & 45 \\ \hline \end{tabular} \begin{tabular}{|c|c|c|c|c|} \hline \multirow{2}{*}{ Sex } & \multicolumn{3}{|c|}{ Education } & \multirow{2}{*}{ Total } \\ \cline { 2 - 4 } & Middle & High School & College & \\ \hline Male & 12 & 13 & 25 & 50 \\ Female & 22 & 13 & 15 & 50 \\ \hline Total & 34 & 26 & 40 & 100 \\ \hline \end{tabular}Step by Step Solution
There are 3 Steps involved in it
Step: 1

Get Instant Access to Expert-Tailored Solutions
See step-by-step solutions with expert insights and AI powered tools for academic success
Step: 2

Step: 3
Ace Your Homework with AI
Get the answers you need in no time with our AI-driven, step-by-step assistance
Get Started
Management And Compliance Audit A Complete Guide
Authors: Gerardus Blokdyk
2020 Edition
0655927727, 978-0655927723