

Question
1.The shares of American Greetings (AG) are currently trading at an EBITDA multiple that is at the bottom of its peer group. Do you think
1.The shares of American Greetings (AG) are currently trading at an EBITDA multiple that is at the bottom of its peer group. Do you think 3.5 times multiple is appropriate for AG? If not, what multiple of EBITDA do you think is justified? What is the implied share price that corresponds to that multiplier?
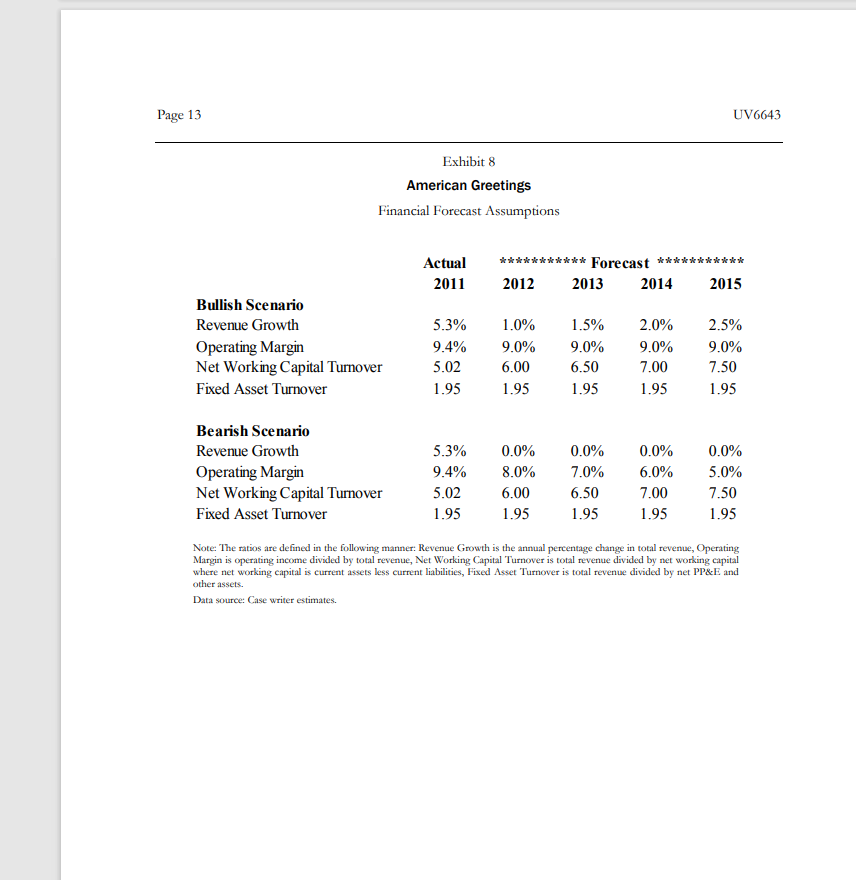
2. Please model cash flows for AG for fiscal year 2012 through 2015 based on the two sets of ratios in case Exhibit 8. Based on discounted cash flows associated with the forecast, what is the implied enterprise value of AG and the corresponding stock price?
3. What are the key drivers of value in your model?
4. What do you believe to be the value of AG shares? Do you recommend repurchasing shares?
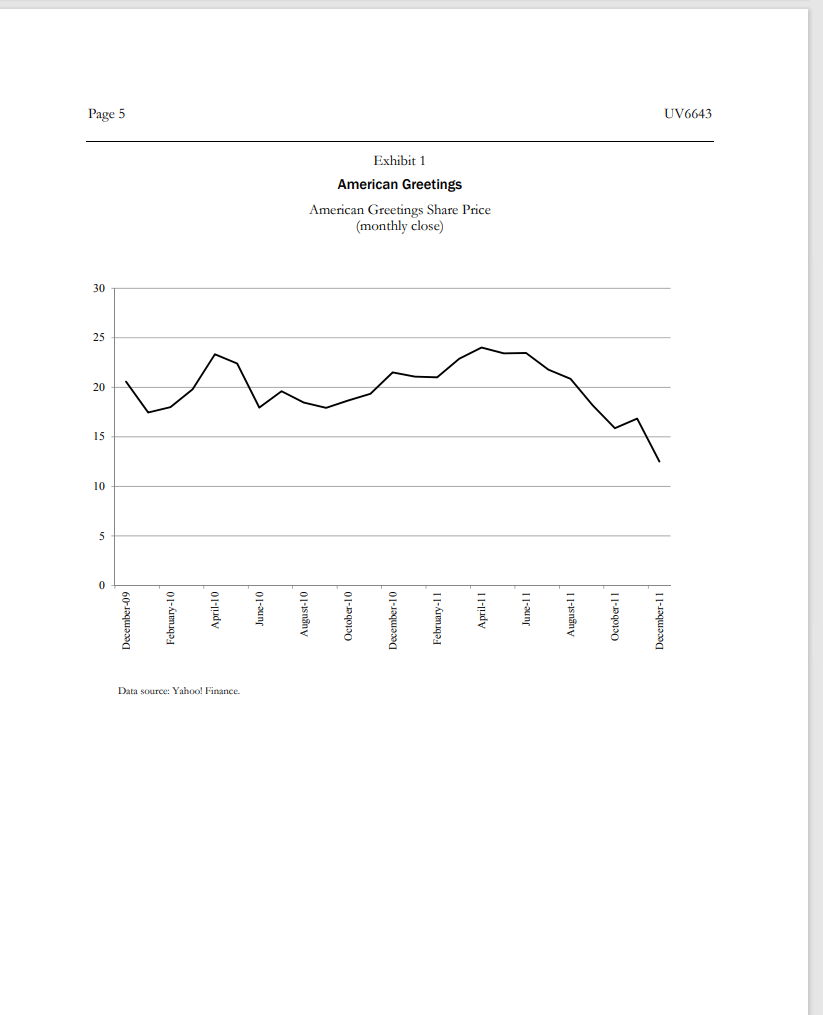
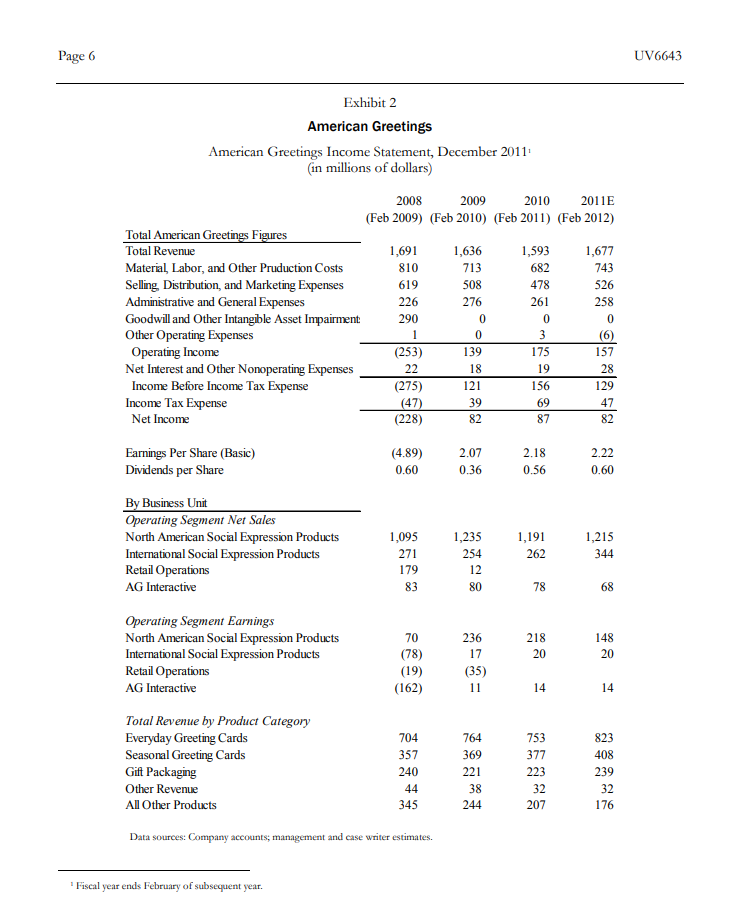
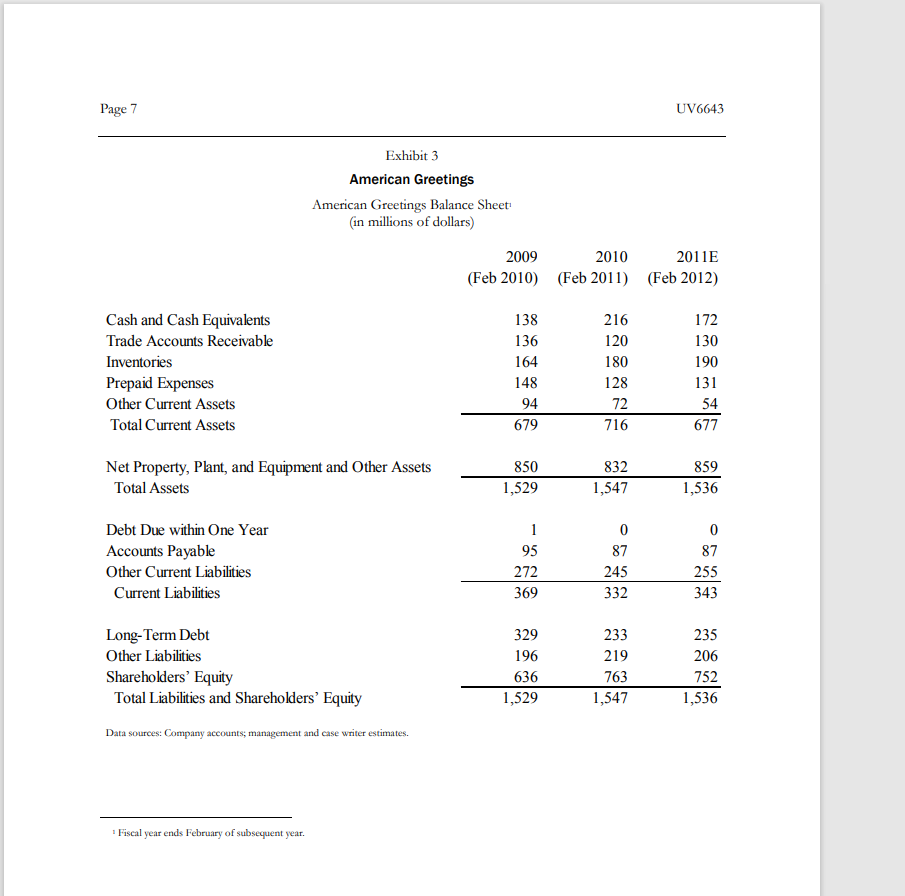
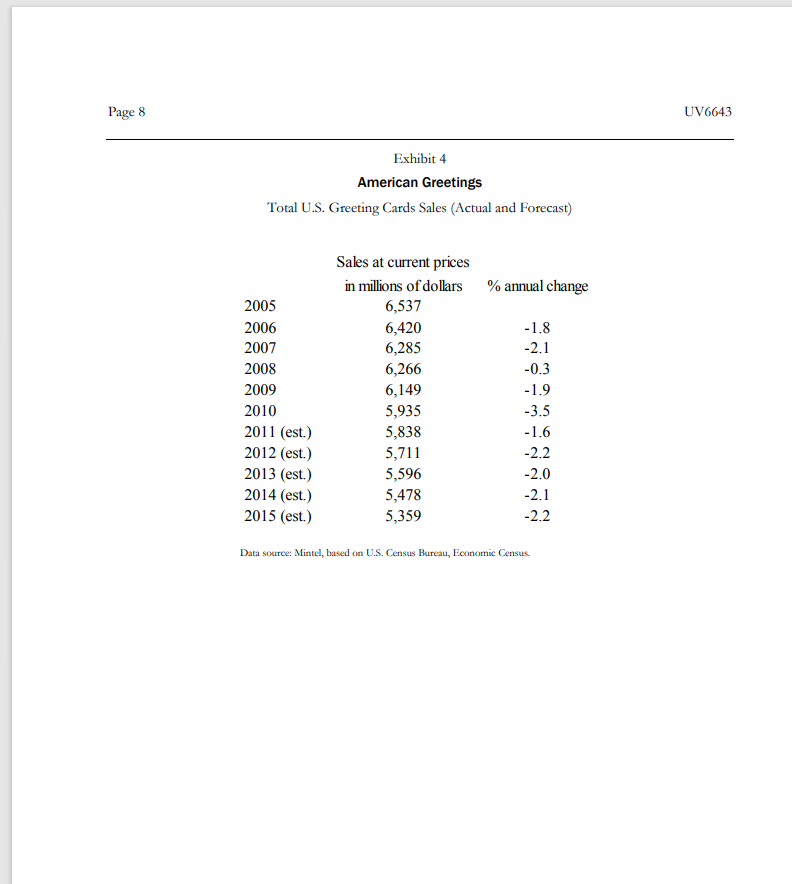
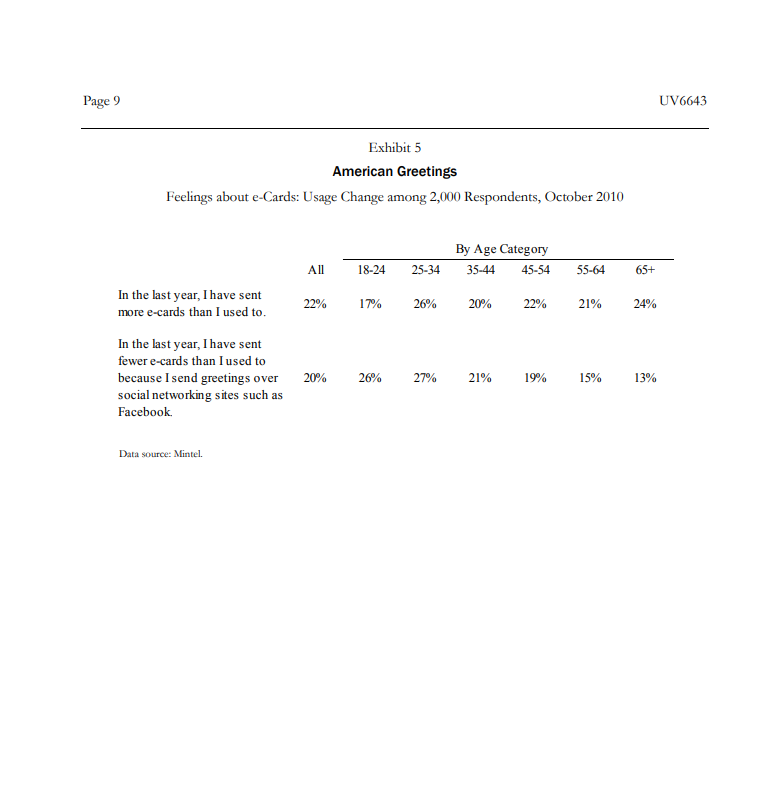
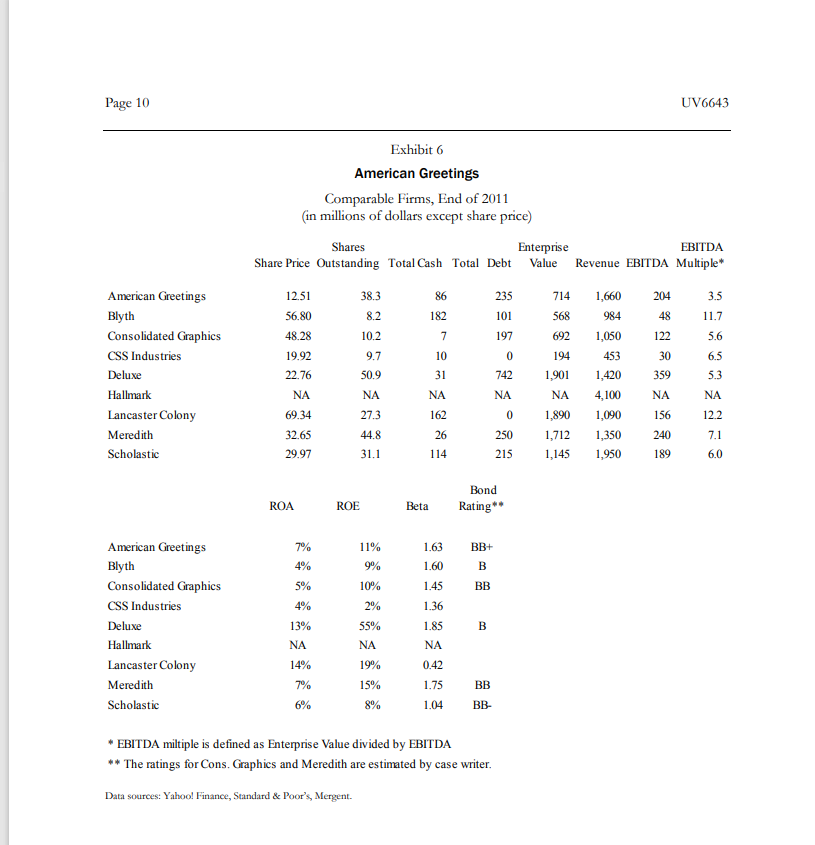
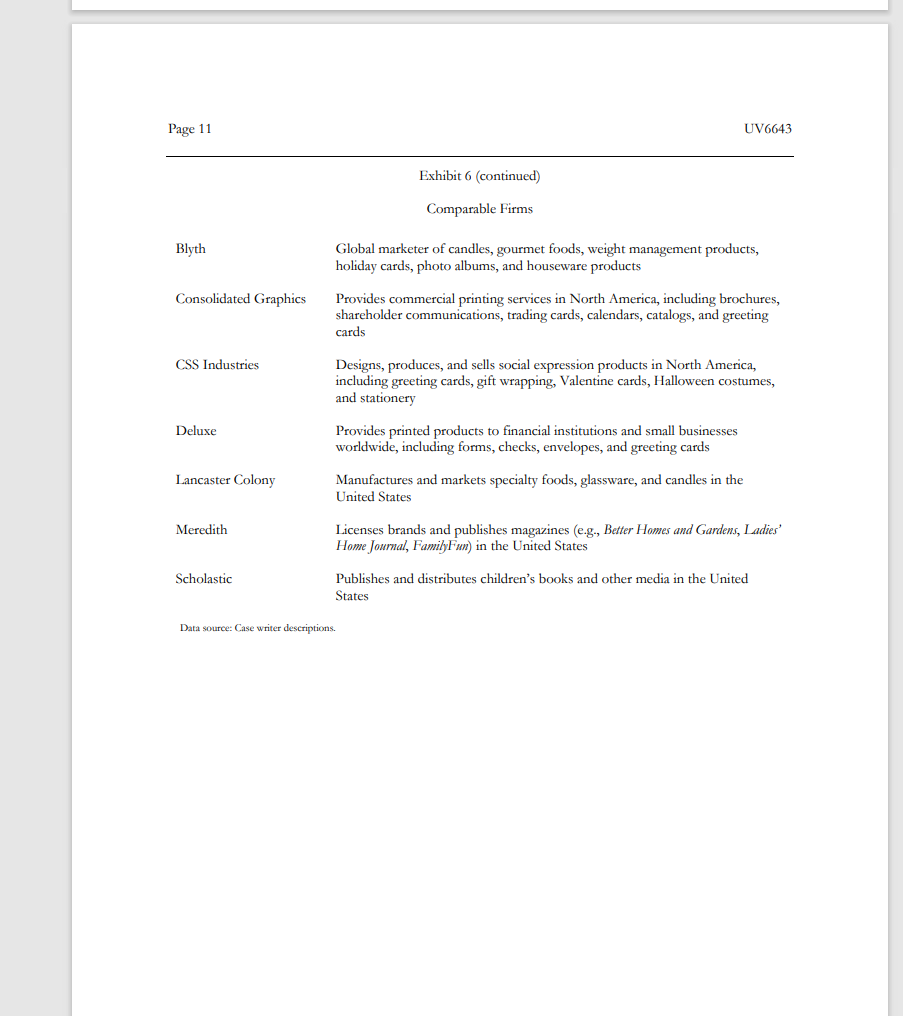
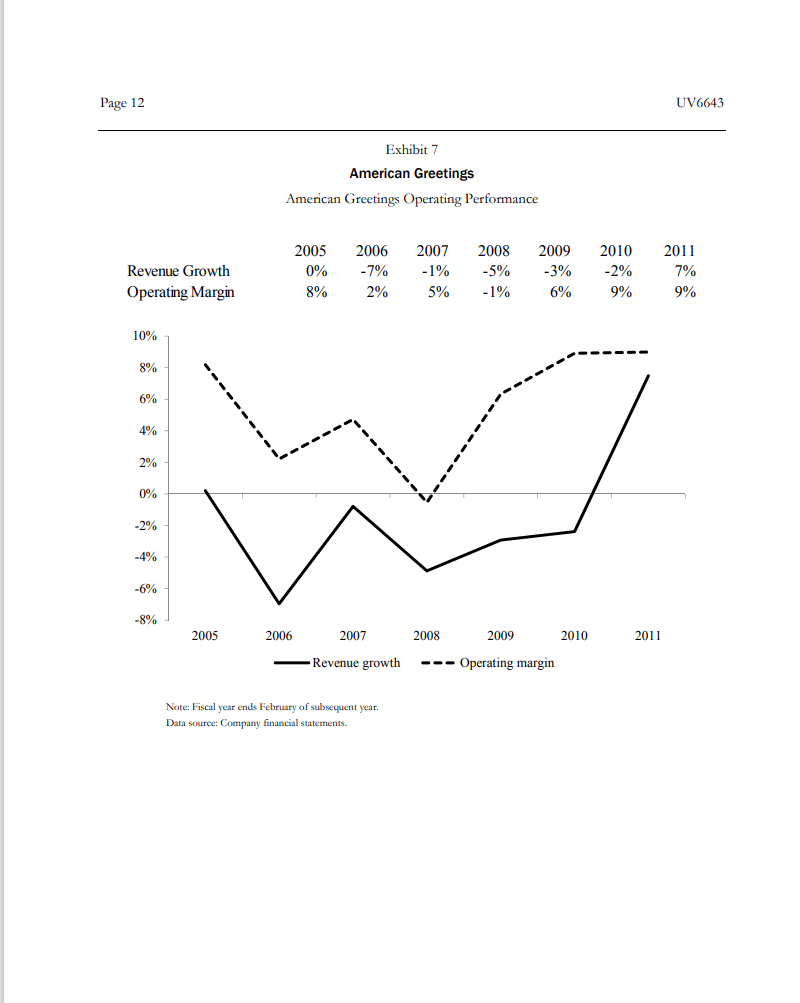
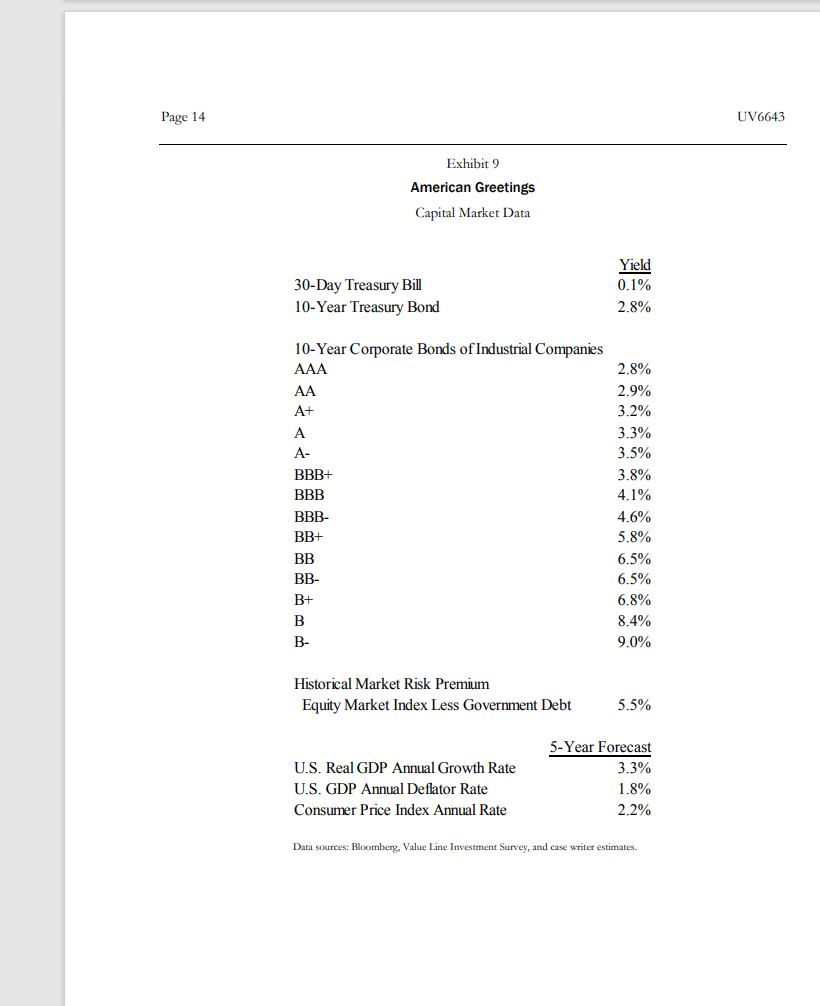
DARDEN MIT BUSINESS PUBLISHING UNIVERSITY VIRGINIA UV6643 Rev. Mar. 4, 2016 American Greetings This year American Greetings is demonstrating to naysayers that the greeting card space is not dead. The company has accelerated top-line growth through a combination of organic growth and acquisitions, and year-to-date revenues are trending well ahead of our forecast . However, the growth has come at a cost that is also far greater than we had anticipated...In Q3 marketing, spending increased by a surprising $10 million... The company also accelerated investment spending in the digital space to support the growth of recently launched cardstore.com. In addition, American Greetings) has incurred... incremental expenses this year to roll out new doors in the dollar-store channel. --Jeff Stein Managing Director, Northcoast Research It was New Year's Day 2012, and the weather was unseasonably warm in Cleveland, Ohio, headquarters for American Greetings Corporation (AG). But while temperatures were up, the same could not be said of AG's share price, which had been cut in half over the previous several months to a year-end closing price of $12.51 (Exhibit 1). At times of low equity valuation, AG management historically had turned to share buybacks. With current valuation levels, management was considering going into the market with a $75 million repurchase program. The repurchase was to be funded from AG's operating profit and cash reserves. The decision hinged on how the future of the enterprise was expected to play out. If the share price reasonably reflected bleak prospects for AG, management should preserve cash for future needs. If, on the other hand, AG stock was simply temporarily out of favor, the buyback plan presented a prudent defensive strategy. American Greetings With $1.7 billion in revenue, AG was the second-largest greeting card publisher in the United States. To meet the changing times, AG sold greeting cards as both paper products through traditional retail channels and electronic products through a number of company websites. In addition to gift cards, AG marketed gift wrap, candles, party goods, candles, and other giftware. To strengthen its business, the company owned and maintained the following major brands: American Greetings, Carlton Cards, Gibson, Recycled Paper Greetings, Papyrus, and Design Ware. AG owned the rights to a variety of popular characters, including Strawberry Shortcake, the Care Bears, Holly Hobbie, the Get Along Gang, and the Nickelodeon characters. The company was able to generate additional revenue by licensing the rights to these characters. Overall, Page 2 UV6643 management positioned AG as a leader in social expression products that assisted "consumers in enhancing their relationships to create happiness, laughter, and love." The company had a long affiliation with the founding Sapirstein family. Shortly after immigrating to the United States in 1905, Jacob Sapirstein, a Polish entrepreneur, launched a business distributing German manufactured postcards in Cleveland with the help of his young family. Eventually the business leadership was passed on to Jacob's oldest son, Irving Stone, then to Irving's son-in-law, Morry Weiss. In 2003, Morry's sons, Zev and Jeffrey Weiss, were appointed as CEO and president, respectively. Morry Weiss continued to serve as chairman. Despite the strong family affiliation, AG was widely held in the public equity markets, with more than 11,000 shareholders, including large positions by such institutional investors as the British investment fund MAM Investments (10.6% of AG shares) and U.S. funds Dimensional Fund Advisors (10.5%), BlackRock (7.9%), and LSV Asset Management (6.7%). Dividend payments to investors had been on an upward trend in recent years, rising from 12 cents per share in 2004 to 56 cents in 2010. Exhibits 2 and 3 provide AG's detailed financial statements. Since AG's fiscal year ended in February, the figures for 2011, for example, included results through February 2012, so remained estimates for the remaining two months. Greeting Cards Two players, Hallmark and AG, dominated the U.S. greetings card industry. Hallmark, privately held by the Hall family, was the larger of the two, with total worldwide revenue at $4 billion. From its headquarters in Kansas City, Missouri, Hallmark had aggressively expanded its business internationally with operations in more than 100 countries. Hallmark maintained licensing agreements with independent Hallmark Gold Crown retail stores that marketed Hallmark products and owned ancillary businesses such as Crayola (the crayon maker) and the Hallmark Channel cable network. Other card companies, such as Avanti Press, Blyth, CSS Industries, and Deluxe had found successful niches in the $6 billion U.S. greeting card market. Mintel, the industry analyst firm, maintained that the overall greeting card market had contracted by 9% since 2005 and that the contraction would continue (Exhibit 4). Mintel's best-case scenario called for a 4% market decline over the next four years; its worst-case called for a 16% decline. The market contraction was thought to be driven by the substitution for greeting cards of other forms of social expression products, due to the ease of such alternative forms as smart phones, electronic social networking, and digital imaging, the last of which affected the traditional Christmas card market in particular. The rapid expansion of social media networks such as Facebook provided even stronger challenges to electronic cards. An industry survey found that the social media substitution was particularly acute in a younger demographic (Exhibit 5). Analysts expected the trend to continue as the ease of digital communication substituted for traditional forms of social expression The industry had responded to the substantive technological shift with important market innovations. Both Hallmark and AG had created an extensive collection of electronic cards that made it easy for customers to send cards electronically. Card manufacturers maintained websites that allowed consumers to purchase paper greeting cards on the Internet via computer or smart phone and have the physical cards delivered directly to the recipient. Kiosks had been placed in retail stores that allowed customers to create Company website. Page 3 UV6643 custom cards. Distribution had expanded to build a substantive presence in the expanding dollar-store retail channel, where greeting cards were reported to be a top-selling item. Despite the trends, large numbers of people continued to buy greeting cards. In a recent survey, 52% of U.S. respondents had purchased a greeting card in the past three months. This figure was down from 59% who had responded affirmatively in 2006.3 Valuation With an end-of-year close of $12.51 per share, AG's PE ratio was at 6 times, its enterprise value to EBITDA ratio at 3.5 times, and its market-to-book ratio was below 1. All these valuation ratios were at the bottom of AG's group of comparable companies. Exhibit 6 contains financial details and business descriptions for the AG-comparable group. AG's management believed its valuation suggested an opportunity, but low levels also demonstrated substantial concern by the capital market regarding the prospects of the company. For example, equity analysts at Standard and Poor's maintained a hold recommendation on the stock, claiming the following: We see [AG's 2012] sales increasing 2.5% to $1.73 billion... We see demand benefitting from increased promotional spending in a more stable economic environment as the company pursues growth within the discount distribution channel...acquisitions... (and) international sales... We expect margins to narrow...reflecting a shift in customer mix toward the discount channel, increasing marketing costs to spur demand, distribution expansion costs, and expenses related to plans to move AG's headquarters building. While we believe channel migration will result in a permanent negative margin shift, we do not believe transition costs related to expanded distribution efforts will be a factor in the long term. Orly Seidman, a Value Line analyst, held a more optimistic view, expecting steady margins and steady long-term growth: The company has been improving the product pipeline. Management should continue to follow consumer and societal trends to better brand its offerings. It has shifted its focus from its core segment to pursue noncard merchandise. Product innovation, stronger retail partnerships, and sell- diversified portfolio ought to drive customer interest in its goods. Technological enhancements will likely remain key to its long-term approach. Over the past few quarters, (AG] rolled out several complementary interactive products (1.e., mobile apps) and should continue to bolster its digital position. It was clear that there was substantial disagreement regarding the future growth trajectory and operating margins for the company. Over the past several years, revenue growth had been near to below zero. In 2011, however, revenue growth was anticipated to be more than 7% Exhibit 7). Similarly, operating margins, which had been abnormally low two to five years previously, had improved to 9% recently. The marginal tax rate for AG income was 39%. 2 Greeting Cards and E-CardsU.S.: February 2011, Mintel report, February 2011. * American Greetings Corp., Standard & Poor's stock report, December 27, 2011. * Orly Seidman, American Greetings, Value Line investment survey, November 11, 2011. Page 4 UV6643 A bullish view held that AG would be able to maintain operating margins at 9% and achieve long-term ongoing revenue growth of 3%. A bearish view held that AG's prospective revenue growth would be near zero into the future and that margins would continue to erode to a long-term rate of 5%. The expectation was that recent investments and ongoing electronic product substitution would generate some future working capital efficiency for AG, but there was little evidence that fixed asset turnover would improve. Exhibit 8 details the specific assumptions for the two scenarios. Management understood that returns and growth were challenging to achieve in early 2012. Yields on U.S. Treasury bills and bonds were at historic lows of 0.1% and 2.8%, respectively Exhibit 9). In such an environment, investors would richly reward returns of even small magnitudes. Page 5 UV6643 Exhibit 1 American Greetings American Greetings Share Price (monthly close) 30 25 20 15 10 5 0 Data source: Yahool Finance Page 6 UV6643 Exhibit 2 American Greetings American Greetings Income Statement, December 2011 (in millions of dollars) 2008 2009 2010 2011E (Feb 2009) (Feb 2010) (Feb 2011) (Feb 2012) Total American Greetings Figures Total Revenue 1,691 1,636 1,593 1,677 Material, Labor, and Other Pruduction Costs 810 713 682 743 Seling Distribution, and Marketing Expenses 619 508 478 526 Administrative and General Expenses 226 276 261 258 Goodwill and Other Intangible Asset Impairment 290 0 0 Other Operating Expenses 0 3 (6) Operating Income (253) 139 175 157 Net Interest and Other Nonoperating Expenses 22 18 19 28 Income Before Income Tax Expense (275) 121 156 129 Income Tax Expense (47) 39 69 Net Income (228) 82 87 82 0 1 47 Earnings Per Share (Basic) Dividends per Share (4.89) 0.60 2.07 0.36 2.18 0.56 2.22 0.60 By Business Unit Operating Segment Net Sales North American Social Expression Products International Social Expression Products Retail Operations AG Interactive 1,191 262 1,215 344 1,095 271 179 83 1,235 254 12 80 78 68 Operating Segment Earnings North American Social Expression Products International Social Expression Products Retail Operations AG Interactive 218 20 148 20 70 (78) (19) (162) 236 17 (35) 11 14 14 823 408 Total Revenue by Product Category Everyday Greeting Cards Seasonal Greeting Cards Gift Packaging Other Revenue Al Other Products 704 357 240 44 345 764 369 221 38 244 753 377 223 32 207 239 32 176 Data sources: Company accounts, management and case writer estimates. Fiscal year ends February of subsequent year. Page 7 UV6643 Exhibit 3 American Greetings American Greetings Balance Sheet (in millions of dollars) 2009 2010 2011E (Feb 2010) (Feb 2011) (Feb 2012) Cash and Cash Equivalents Trade Accounts Receivable Inventories Prepaid Expenses Other Current Assets Total Current Assets 138 136 164 148 94 679 216 120 180 128 72 716 172 130 190 131 54 677 Net Property, Plant, and Equipment and Other Assets Total Assets 850 1,529 832 1,547 859 1,536 0 87 Debt Due within One Year Accounts Payable Other Current Liabilities Current Liabilities 1 95 272 369 0 87 255 343 245 332 Long-Term Debt Other Liabilities Shareholders' Equity Total Liabilities and Shareholders' Equity 329 196 636 1,529 233 219 763 1,547 235 206 752 1,536 Data sources: Company accounts, management and case writer estimates. Fiscal year ends February of subsequent year. Page 8 UV6643 Exhibit 4 American Greetings Total U.S. Greeting Cards Sales (Actual and Forecast) 2005 2006 2007 2008 2009 2010 2011 (est.) 2012 (est.) 2013 (est.) 2014 (est.) 2015 (est.) Sales at current prices in millions of dollars % annual change 6,537 6,420 -1.8 6,285 -2.1 6,266 -0.3 6,149 -1.9 5,935 -3.5 5,838 -1.6 5,711 -2.2 5,596 -2.0 5,478 -2.1 5,359 -2.2 Data source: Mintel, based on U.S. Census Bureau, Economic Census Page 9 UV6643 Exhibit 5 American Greetings Feelings about e-Cards: Usage Change among 2,000 Respondents, October 2010 By Age Category 35-44 45-54 All 18-24 25-34 55-64 65+ In the last year, I have sent more e-cards than I used to. 22% 17% 26% 20% 22% 21% 24% In the last year, I have sent fewer e-cards than I used to because I send greetings over social networking sites such as Facebook 20% 26% 27% 21% 19% 15% 13% Data source: Mintel. Page 10 UV6643 Exhibit 6 American Greetings Comparable Firms, End of 2011 (in millions of dollars except share price) Shares Enterprise Share Price Outstanding Total Cash Total Debt Value EBITDA Revenue EBITDA Multiple* 86 714 204 3.5 38.3 8.2 235 101 182 568 48 11.7 10.2 7 197 692 122 5.6 12.51 56.80 48.28 19.92 22.76 NA 9.7 10 0 194 American Greetings Blyth Consolidated Graphics CSS Industries Deluxe Hallmark Lancaster Colony Meredith Scholastic 30 6.5 5.3 50.9 31 742 1,660 984 1,050 453 1,420 4,100 1,090 1,350 1,950 359 NA NA NA NA NA 69.34 27.3 162 1,901 NA 1,890 1,712 1,145 0 156 122 26 250 240 32.65 29.97 44.8 31.1 7.1 6.0 114 215 189 Bond Rating** ROA ROE Beta 7% 11% 1.63 BB+ 4% 9% 1.60 B 5% 10% 1.45 BB 4% 2% 1.36 American Greetings Blyth Consolidated Graphics CSS Industries Deluxe Hallmark Lancaster Colony Meredith Scholastic 55% 1.85 B 13% NA NA NA 19% 0.42 14% 7% 6% 15% 1.75 BB BB- 8% 1.04 * EBITDA miltiple is defined as Enterprise Value divided by EBITDA ** The ratings for Cons. Graphics and Meredith are estimated by case writer. Data sources: Yahool Finance, Standard & Poor's, Mergent. Page 11 UV6643 Exhibit 6 (continued) Comparable Firms Blyth Global marketer of candles, gourmet foods, weight management products, holiday cards, photo albums, and houseware products Consolidated Graphics Provides commercial printing services in North America, including brochures, shareholder communications, trading cards, calendars, catalogs, and greeting cards CSS Industries Deluxe Designs, produces, and sells social expression products in North America, including greeting cards, gift wrapping, Valentine cards, Halloween costumes, and stationery Provides printed products to financial institutions and small businesses worldwide, including forms, checks, envelopes, and greeting cards Manufactures and markets specialty foods, glassware, and candles in the United States Lancaster Colony Meredith Licenses brands and publishes magazines (e.g., Better Homes and Gardens, Ladies' Home Journal, FamilyFun) in the United States Scholastic Publishes and distributes children's books and other media in the United States Data source: Case writer descriptions. Page 12 UV6643 Exhibit 7 American Greetings American Greetings Operating Performance Revenue Growth Operating Margin 2005 0% 8% 2006 -7% 2% 2007 - 1% 5% 2008 -5% - 1% 2009 -3% 6% 2010 -2% 9% 2011 7% 9% 10% 8% 6% 4% 2% 0% -2% -4% -6% -8% 2005 2006 2007 2008 2009 2010 2011 Revenue growth --- Operating margin Note: Fiscal year ends February of subsequent year. Data source: Company financial statements. Page 13 UV6643 Exhibit 8 American Greetings Financial Forecast Assumptions Actual 2011 *********** Forecast *********** 2012 2013 2014 2015 Bullish Scenario Revenue Growth Operating Margin Net Working Capital Turnover Fixed Asset Turnover 5.3% 9.4% 5.02 1.95 1.0% 9.0% 6.00 1.95 1.5% 9.0% 6.50 1.95 2.0% 9.0% 7.00 1.95 2.5% 9.0% 7.50 1.95 Bearish Scenario Revenue Growth Operating Margin Net Working Capital Turnover Fixed Asset Turnover 5.3% 9.4% 5.02 1.95 0.0% 8.0% 6.00 1.95 0.0% 7.0% 6.50 1.95 0.0% 6.0% 7.00 1.95 0.0% 5.0% 7.50 1.95 Note: The ratios are defined in the following manner: Revenue Growth is the annual percentage change in total revenue, Operating Margin is operating income divided by total revenue, Net Working Capital Turnover is total revenue divided by net working capital where net working capital is current assets less current liabilities, Fixed Asset Turnover is total revenue divided by net PP&E and other assets. Data source: Case writer estimates. Page 14 UV6643 Exhibit 9 American Greetings Capital Market Data 30-Day Treasury Bill 10-Year Treasury Bond Yield 0.1% 2.8% 10-Year Corporate Bonds of Industrial Companies AAA AA A+ A A- BBB+ BBB BBB- BB+ BB BB- B+ B B- 2.8% 2.9% 3.2% 3.3% 3.5% 3.8% 4.1% 4.6% 5.8% 6.5% 6.5% 6.8% 8.4% 9.0% Historical Market Risk Premium Equity Market Index Less Government Debt 5.5% U.S. Real GDP Annual Growth Rate U.S. GDP Annual Deflator Rate Consumer Price Index Annual Rate 5-Year Forecast 3.3% 1.8% 2.2% Data sources: Bloomberg, Value Line Investment Survey, and case writer estimates DARDEN MIT BUSINESS PUBLISHING UNIVERSITY VIRGINIA UV6643 Rev. Mar. 4, 2016 American Greetings This year American Greetings is demonstrating to naysayers that the greeting card space is not dead. The company has accelerated top-line growth through a combination of organic growth and acquisitions, and year-to-date revenues are trending well ahead of our forecast . However, the growth has come at a cost that is also far greater than we had anticipated...In Q3 marketing, spending increased by a surprising $10 million... The company also accelerated investment spending in the digital space to support the growth of recently launched cardstore.com. In addition, American Greetings) has incurred... incremental expenses this year to roll out new doors in the dollar-store channel. --Jeff Stein Managing Director, Northcoast Research It was New Year's Day 2012, and the weather was unseasonably warm in Cleveland, Ohio, headquarters for American Greetings Corporation (AG). But while temperatures were up, the same could not be said of AG's share price, which had been cut in half over the previous several months to a year-end closing price of $12.51 (Exhibit 1). At times of low equity valuation, AG management historically had turned to share buybacks. With current valuation levels, management was considering going into the market with a $75 million repurchase program. The repurchase was to be funded from AG's operating profit and cash reserves. The decision hinged on how the future of the enterprise was expected to play out. If the share price reasonably reflected bleak prospects for AG, management should preserve cash for future needs. If, on the other hand, AG stock was simply temporarily out of favor, the buyback plan presented a prudent defensive strategy. American Greetings With $1.7 billion in revenue, AG was the second-largest greeting card publisher in the United States. To meet the changing times, AG sold greeting cards as both paper products through traditional retail channels and electronic products through a number of company websites. In addition to gift cards, AG marketed gift wrap, candles, party goods, candles, and other giftware. To strengthen its business, the company owned and maintained the following major brands: American Greetings, Carlton Cards, Gibson, Recycled Paper Greetings, Papyrus, and Design Ware. AG owned the rights to a variety of popular characters, including Strawberry Shortcake, the Care Bears, Holly Hobbie, the Get Along Gang, and the Nickelodeon characters. The company was able to generate additional revenue by licensing the rights to these characters. Overall, Page 2 UV6643 management positioned AG as a leader in social expression products that assisted "consumers in enhancing their relationships to create happiness, laughter, and love." The company had a long affiliation with the founding Sapirstein family. Shortly after immigrating to the United States in 1905, Jacob Sapirstein, a Polish entrepreneur, launched a business distributing German manufactured postcards in Cleveland with the help of his young family. Eventually the business leadership was passed on to Jacob's oldest son, Irving Stone, then to Irving's son-in-law, Morry Weiss. In 2003, Morry's sons, Zev and Jeffrey Weiss, were appointed as CEO and president, respectively. Morry Weiss continued to serve as chairman. Despite the strong family affiliation, AG was widely held in the public equity markets, with more than 11,000 shareholders, including large positions by such institutional investors as the British investment fund MAM Investments (10.6% of AG shares) and U.S. funds Dimensional Fund Advisors (10.5%), BlackRock (7.9%), and LSV Asset Management (6.7%). Dividend payments to investors had been on an upward trend in recent years, rising from 12 cents per share in 2004 to 56 cents in 2010. Exhibits 2 and 3 provide AG's detailed financial statements. Since AG's fiscal year ended in February, the figures for 2011, for example, included results through February 2012, so remained estimates for the remaining two months. Greeting Cards Two players, Hallmark and AG, dominated the U.S. greetings card industry. Hallmark, privately held by the Hall family, was the larger of the two, with total worldwide revenue at $4 billion. From its headquarters in Kansas City, Missouri, Hallmark had aggressively expanded its business internationally with operations in more than 100 countries. Hallmark maintained licensing agreements with independent Hallmark Gold Crown retail stores that marketed Hallmark products and owned ancillary businesses such as Crayola (the crayon maker) and the Hallmark Channel cable network. Other card companies, such as Avanti Press, Blyth, CSS Industries, and Deluxe had found successful niches in the $6 billion U.S. greeting card market. Mintel, the industry analyst firm, maintained that the overall greeting card market had contracted by 9% since 2005 and that the contraction would continue (Exhibit 4). Mintel's best-case scenario called for a 4% market decline over the next four years; its worst-case called for a 16% decline. The market contraction was thought to be driven by the substitution for greeting cards of other forms of social expression products, due to the ease of such alternative forms as smart phones, electronic social networking, and digital imaging, the last of which affected the traditional Christmas card market in particular. The rapid expansion of social media networks such as Facebook provided even stronger challenges to electronic cards. An industry survey found that the social media substitution was particularly acute in a younger demographic (Exhibit 5). Analysts expected the trend to continue as the ease of digital communication substituted for traditional forms of social expression The industry had responded to the substantive technological shift with important market innovations. Both Hallmark and AG had created an extensive collection of electronic cards that made it easy for customers to send cards electronically. Card manufacturers maintained websites that allowed consumers to purchase paper greeting cards on the Internet via computer or smart phone and have the physical cards delivered directly to the recipient. Kiosks had been placed in retail stores that allowed customers to create Company website. Page 3 UV6643 custom cards. Distribution had expanded to build a substantive presence in the expanding dollar-store retail channel, where greeting cards were reported to be a top-selling item. Despite the trends, large numbers of people continued to buy greeting cards. In a recent survey, 52% of U.S. respondents had purchased a greeting card in the past three months. This figure was down from 59% who had responded affirmatively in 2006.3 Valuation With an end-of-year close of $12.51 per share, AG's PE ratio was at 6 times, its enterprise value to EBITDA ratio at 3.5 times, and its market-to-book ratio was below 1. All these valuation ratios were at the bottom of AG's group of comparable companies. Exhibit 6 contains financial details and business descriptions for the AG-comparable group. AG's management believed its valuation suggested an opportunity, but low levels also demonstrated substantial concern by the capital market regarding the prospects of the company. For example, equity analysts at Standard and Poor's maintained a hold recommendation on the stock, claiming the following: We see [AG's 2012] sales increasing 2.5% to $1.73 billion... We see demand benefitting from increased promotional spending in a more stable economic environment as the company pursues growth within the discount distribution channel...acquisitions... (and) international sales... We expect margins to narrow...reflecting a shift in customer mix toward the discount channel, increasing marketing costs to spur demand, distribution expansion costs, and expenses related to plans to move AG's headquarters building. While we believe channel migration will result in a permanent negative margin shift, we do not believe transition costs related to expanded distribution efforts will be a factor in the long term. Orly Seidman, a Value Line analyst, held a more optimistic view, expecting steady margins and steady long-term growth: The company has been improving the product pipeline. Management should continue to follow consumer and societal trends to better brand its offerings. It has shifted its focus from its core segment to pursue noncard merchandise. Product innovation, stronger retail partnerships, and sell- diversified portfolio ought to drive customer interest in its goods. Technological enhancements will likely remain key to its long-term approach. Over the past few quarters, (AG] rolled out several complementary interactive products (1.e., mobile apps) and should continue to bolster its digital position. It was clear that there was substantial disagreement regarding the future growth trajectory and operating margins for the company. Over the past several years, revenue growth had been near to below zero. In 2011, however, revenue growth was anticipated to be more than 7% Exhibit 7). Similarly, operating margins, which had been abnormally low two to five years previously, had improved to 9% recently. The marginal tax rate for AG income was 39%. 2 Greeting Cards and E-CardsU.S.: February 2011, Mintel report, February 2011. * American Greetings Corp., Standard & Poor's stock report, December 27, 2011. * Orly Seidman, American Greetings, Value Line investment survey, November 11, 2011. Page 4 UV6643 A bullish view held that AG would be able to maintain operating margins at 9% and achieve long-term ongoing revenue growth of 3%. A bearish view held that AG's prospective revenue growth would be near zero into the future and that margins would continue to erode to a long-term rate of 5%. The expectation was that recent investments and ongoing electronic product substitution would generate some future working capital efficiency for AG, but there was little evidence that fixed asset turnover would improve. Exhibit 8 details the specific assumptions for the two scenarios. Management understood that returns and growth were challenging to achieve in early 2012. Yields on U.S. Treasury bills and bonds were at historic lows of 0.1% and 2.8%, respectively Exhibit 9). In such an environment, investors would richly reward returns of even small magnitudes. Page 5 UV6643 Exhibit 1 American Greetings American Greetings Share Price (monthly close) 30 25 20 15 10 5 0 Data source: Yahool Finance Page 6 UV6643 Exhibit 2 American Greetings American Greetings Income Statement, December 2011 (in millions of dollars) 2008 2009 2010 2011E (Feb 2009) (Feb 2010) (Feb 2011) (Feb 2012) Total American Greetings Figures Total Revenue 1,691 1,636 1,593 1,677 Material, Labor, and Other Pruduction Costs 810 713 682 743 Seling Distribution, and Marketing Expenses 619 508 478 526 Administrative and General Expenses 226 276 261 258 Goodwill and Other Intangible Asset Impairment 290 0 0 Other Operating Expenses 0 3 (6) Operating Income (253) 139 175 157 Net Interest and Other Nonoperating Expenses 22 18 19 28 Income Before Income Tax Expense (275) 121 156 129 Income Tax Expense (47) 39 69 Net Income (228) 82 87 82 0 1 47 Earnings Per Share (Basic) Dividends per Share (4.89) 0.60 2.07 0.36 2.18 0.56 2.22 0.60 By Business Unit Operating Segment Net Sales North American Social Expression Products International Social Expression Products Retail Operations AG Interactive 1,191 262 1,215 344 1,095 271 179 83 1,235 254 12 80 78 68 Operating Segment Earnings North American Social Expression Products International Social Expression Products Retail Operations AG Interactive 218 20 148 20 70 (78) (19) (162) 236 17 (35) 11 14 14 823 408 Total Revenue by Product Category Everyday Greeting Cards Seasonal Greeting Cards Gift Packaging Other Revenue Al Other Products 704 357 240 44 345 764 369 221 38 244 753 377 223 32 207 239 32 176 Data sources: Company accounts, management and case writer estimates. Fiscal year ends February of subsequent year. Page 7 UV6643 Exhibit 3 American Greetings American Greetings Balance Sheet (in millions of dollars) 2009 2010 2011E (Feb 2010) (Feb 2011) (Feb 2012) Cash and Cash Equivalents Trade Accounts Receivable Inventories Prepaid Expenses Other Current Assets Total Current Assets 138 136 164 148 94 679 216 120 180 128 72 716 172 130 190 131 54 677 Net Property, Plant, and Equipment and Other Assets Total Assets 850 1,529 832 1,547 859 1,536 0 87 Debt Due within One Year Accounts Payable Other Current Liabilities Current Liabilities 1 95 272 369 0 87 255 343 245 332 Long-Term Debt Other Liabilities Shareholders' Equity Total Liabilities and Shareholders' Equity 329 196 636 1,529 233 219 763 1,547 235 206 752 1,536 Data sources: Company accounts, management and case writer estimates. Fiscal year ends February of subsequent year. Page 8 UV6643 Exhibit 4 American Greetings Total U.S. Greeting Cards Sales (Actual and Forecast) 2005 2006 2007 2008 2009 2010 2011 (est.) 2012 (est.) 2013 (est.) 2014 (est.) 2015 (est.) Sales at current prices in millions of dollars % annual change 6,537 6,420 -1.8 6,285 -2.1 6,266 -0.3 6,149 -1.9 5,935 -3.5 5,838 -1.6 5,711 -2.2 5,596 -2.0 5,478 -2.1 5,359 -2.2 Data source: Mintel, based on U.S. Census Bureau, Economic Census Page 9 UV6643 Exhibit 5 American Greetings Feelings about e-Cards: Usage Change among 2,000 Respondents, October 2010 By Age Category 35-44 45-54 All 18-24 25-34 55-64 65+ In the last year, I have sent more e-cards than I used to. 22% 17% 26% 20% 22% 21% 24% In the last year, I have sent fewer e-cards than I used to because I send greetings over social networking sites such as Facebook 20% 26% 27% 21% 19% 15% 13% Data source: Mintel. Page 10 UV6643 Exhibit 6 American Greetings Comparable Firms, End of 2011 (in millions of dollars except share price) Shares Enterprise Share Price Outstanding Total Cash Total Debt Value EBITDA Revenue EBITDA Multiple* 86 714 204 3.5 38.3 8.2 235 101 182 568 48 11.7 10.2 7 197 692 122 5.6 12.51 56.80 48.28 19.92 22.76 NA 9.7 10 0 194 American Greetings Blyth Consolidated Graphics CSS Industries Deluxe Hallmark Lancaster Colony Meredith Scholastic 30 6.5 5.3 50.9 31 742 1,660 984 1,050 453 1,420 4,100 1,090 1,350 1,950 359 NA NA NA NA NA 69.34 27.3 162 1,901 NA 1,890 1,712 1,145 0 156 122 26 250 240 32.65 29.97 44.8 31.1 7.1 6.0 114 215 189 Bond Rating** ROA ROE Beta 7% 11% 1.63 BB+ 4% 9% 1.60 B 5% 10% 1.45 BB 4% 2% 1.36 American Greetings Blyth Consolidated Graphics CSS Industries Deluxe Hallmark Lancaster Colony Meredith Scholastic 55% 1.85 B 13% NA NA NA 19% 0.42 14% 7% 6% 15% 1.75 BB BB- 8% 1.04 * EBITDA miltiple is defined as Enterprise Value divided by EBITDA ** The ratings for Cons. Graphics and Meredith are estimated by case writer. Data sources: Yahool Finance, Standard & Poor's, Mergent. Page 11 UV6643 Exhibit 6 (continued) Comparable Firms Blyth Global marketer of candles, gourmet foods, weight management products, holiday cards, photo albums, and houseware products Consolidated Graphics Provides commercial printing services in North America, including brochures, shareholder communications, trading cards, calendars, catalogs, and greeting cards CSS Industries Deluxe Designs, produces, and sells social expression products in North America, including greeting cards, gift wrapping, Valentine cards, Halloween costumes, and stationery Provides printed products to financial institutions and small businesses worldwide, including forms, checks, envelopes, and greeting cards Manufactures and markets specialty foods, glassware, and candles in the United States Lancaster Colony Meredith Licenses brands and publishes magazines (e.g., Better Homes and Gardens, Ladies' Home Journal, FamilyFun) in the United States Scholastic Publishes and distributes children's books and other media in the United States Data source: Case writer descriptions. Page 12 UV6643 Exhibit 7 American Greetings American Greetings Operating Performance Revenue Growth Operating Margin 2005 0% 8% 2006 -7% 2% 2007 - 1% 5% 2008 -5% - 1% 2009 -3% 6% 2010 -2% 9% 2011 7% 9% 10% 8% 6% 4% 2% 0% -2% -4% -6% -8% 2005 2006 2007 2008 2009 2010 2011 Revenue growth --- Operating margin Note: Fiscal year ends February of subsequent year. Data source: Company financial statements. Page 13 UV6643 Exhibit 8 American Greetings Financial Forecast Assumptions Actual 2011 *********** Forecast *********** 2012 2013 2014 2015 Bullish Scenario Revenue Growth Operating Margin Net Working Capital Turnover Fixed Asset Turnover 5.3% 9.4% 5.02 1.95 1.0% 9.0% 6.00 1.95 1.5% 9.0% 6.50 1.95 2.0% 9.0% 7.00 1.95 2.5% 9.0% 7.50 1.95 Bearish Scenario Revenue Growth Operating Margin Net Working Capital Turnover Fixed Asset Turnover 5.3% 9.4% 5.02 1.95 0.0% 8.0% 6.00 1.95 0.0% 7.0% 6.50 1.95 0.0% 6.0% 7.00 1.95 0.0% 5.0% 7.50 1.95 Note: The ratios are defined in the following manner: Revenue Growth is the annual percentage change in total revenue, Operating Margin is operating income divided by total revenue, Net Working Capital Turnover is total revenue divided by net working capital where net working capital is current assets less current liabilities, Fixed Asset Turnover is total revenue divided by net PP&E and other assets. Data source: Case writer estimates. Page 14 UV6643 Exhibit 9 American Greetings Capital Market Data 30-Day Treasury Bill 10-Year Treasury Bond Yield 0.1% 2.8% 10-Year Corporate Bonds of Industrial Companies AAA AA A+ A A- BBB+ BBB BBB- BB+ BB BB- B+ B B- 2.8% 2.9% 3.2% 3.3% 3.5% 3.8% 4.1% 4.6% 5.8% 6.5% 6.5% 6.8% 8.4% 9.0% Historical Market Risk Premium Equity Market Index Less Government Debt 5.5% U.S. Real GDP Annual Growth Rate U.S. GDP Annual Deflator Rate Consumer Price Index Annual Rate 5-Year Forecast 3.3% 1.8% 2.2% Data sources: Bloomberg, Value Line Investment Survey, and case writer estimates
Step by Step Solution
There are 3 Steps involved in it
Step: 1

Get Instant Access to Expert-Tailored Solutions
See step-by-step solutions with expert insights and AI powered tools for academic success
Step: 2

Step: 3
Ace Your Homework with AI
Get the answers you need in no time with our AI-driven, step-by-step assistance
Get Started
Personal Finance Essentials Saving And Investing
Authors: Julia A Heath
1st Edition
1604139897, 9781604139891