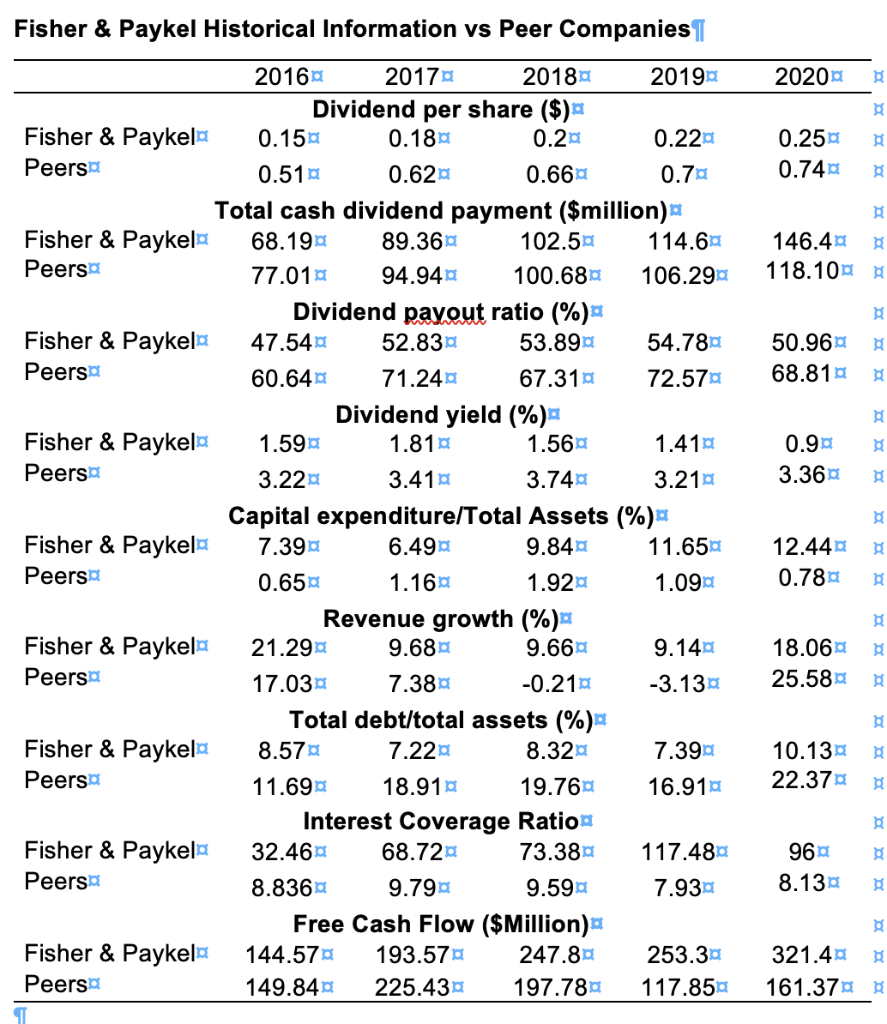
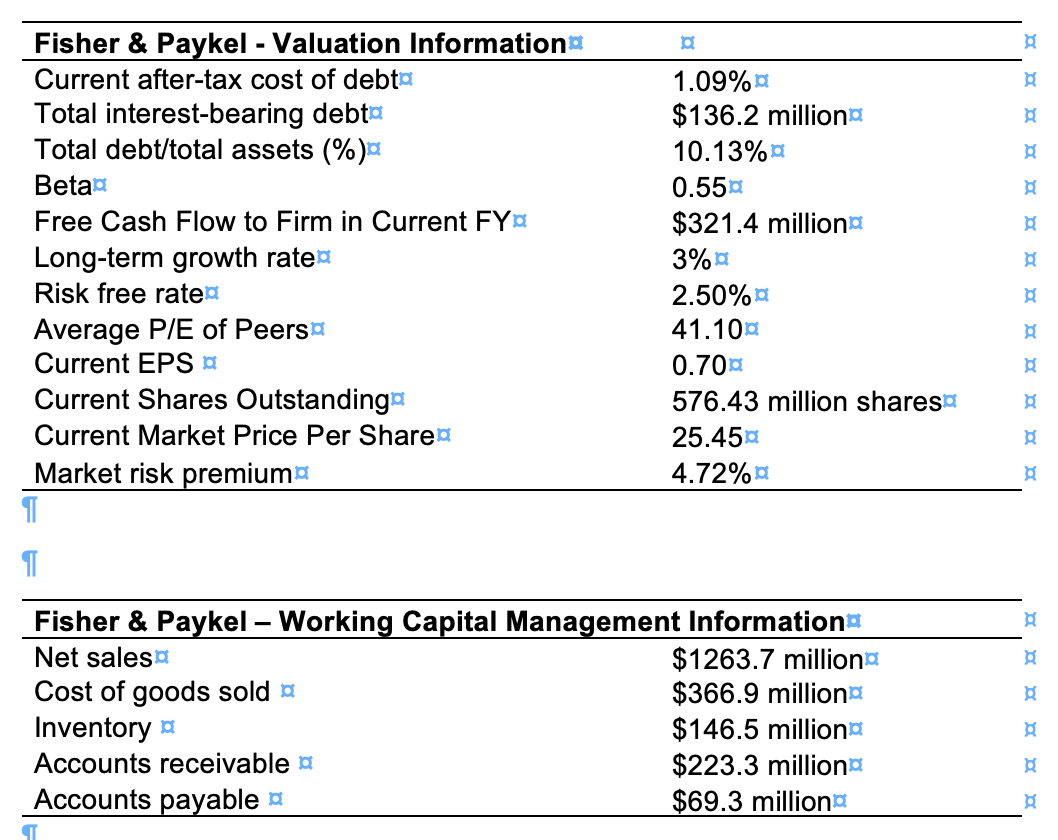
1.Using the average peer P/E ratio and the firm's earnings per share, calculate the current value of Fisher & Paykel Healthcare using the P/E ratio multiple.
2.Considering the current market price per share, would you recommend a shareholder buy, sell or hold based on the price you have calculated? In answering this question, make sure that you identify the difference/s between the DCF and multiples approaches and explain which method you would place the most emphasis on when giving advice?


Fisher & Paykel Historical Information vs Peer Companies || 2020 8 0.250 0.740 8 $ 146.40 118.100 8 50.960 68.810 8 0.90 3.36 8 20160 2017 20180 2019 Dividend per share ($) Fisher & Paykela 0.150 0.180 0.20 0.220 Peers 0.51 0.620 0.660 0.70 Total cash dividend payment ($million)" Fisher & Paykela 68.190 89.36 102.50 114.60 Peers 77.010 94.940 100.680 106.29 Dividend payout ratio (%)* Fisher & Paykela 47.540 52.83 53.890 54.780 Peers 60.640 71.240 67.310 72.570 Dividend yield (%)* Fisher & Paykela 1.59 1.810 1.560 1.419 Peers 3.22 3.410 3.740 3.210 Capital expenditure/Total Assets (%) Fisher & Paykel 7.39 6.490 9.840 11.650 Peers 0.650 1.160 1.920 1.09 Revenue growth (%) Fisher & Paykela 21.290 9.680 9.660 9.140 Peers 17.030 7.380 -0.210 -3.130 Total debt/total assets (%) Fisher & Paykela 8.57 7.220 8.32 7.39 Peers 11.69 18.91 19.760 16.910 Interest Coverage Ration Fisher & Paykela 32.46 68.720 73.380 117.480 Peers 8.836 9.790 9.59 7.930 Free Cash Flow ($Million) Fisher & Paykela 144.57 193.57 247.80 253.30 Peers 149.840 225.430 197.780 117.850 T $ 12.44 0.780 8 $ 18.06 25.580 $ $ 10.130 22.370 $ $ 960 8.130 8 8 $ 321.40 161.370 8 $ 8 $ 8 Fisher & Paykel - Valuation Informationa Current after-tax cost of debto Total interest-bearing debta Total debt/total assets (%)a Beta Free Cash Flow to Firm in Current Fya Long-term growth rated Risk free rate Average P/E of Peerso Current EPS a Current Shares Outstandinga Current Market Price Per Shared Market risk premium $ 1.09% $136.2 milliona 10.13% 0.550 $321.4 milliona 3% 2.50% 41.100 0.700 576.43 million sharesa 25.450 4.72% $ $ $ 8 $ $ $ 8 Fisher & Paykel Working Capital Management Informationa Net sales $1263.7 milliona Cost of goods sold a $366.9 milliona Inventory a $146.5 milliona Accounts receivable a $223.3 milliona Accounts payable a $69.3 milliona $ 8 T Fisher & Paykel Historical Information vs Peer Companies || 2020 8 0.250 0.740 8 $ 146.40 118.100 8 50.960 68.810 8 0.90 3.36 8 20160 2017 20180 2019 Dividend per share ($) Fisher & Paykela 0.150 0.180 0.20 0.220 Peers 0.51 0.620 0.660 0.70 Total cash dividend payment ($million)" Fisher & Paykela 68.190 89.36 102.50 114.60 Peers 77.010 94.940 100.680 106.29 Dividend payout ratio (%)* Fisher & Paykela 47.540 52.83 53.890 54.780 Peers 60.640 71.240 67.310 72.570 Dividend yield (%)* Fisher & Paykela 1.59 1.810 1.560 1.419 Peers 3.22 3.410 3.740 3.210 Capital expenditure/Total Assets (%) Fisher & Paykel 7.39 6.490 9.840 11.650 Peers 0.650 1.160 1.920 1.09 Revenue growth (%) Fisher & Paykela 21.290 9.680 9.660 9.140 Peers 17.030 7.380 -0.210 -3.130 Total debt/total assets (%) Fisher & Paykela 8.57 7.220 8.32 7.39 Peers 11.69 18.91 19.760 16.910 Interest Coverage Ration Fisher & Paykela 32.46 68.720 73.380 117.480 Peers 8.836 9.790 9.59 7.930 Free Cash Flow ($Million) Fisher & Paykela 144.57 193.57 247.80 253.30 Peers 149.840 225.430 197.780 117.850 T $ 12.44 0.780 8 $ 18.06 25.580 $ $ 10.130 22.370 $ $ 960 8.130 8 8 $ 321.40 161.370 8 $ 8 $ 8 Fisher & Paykel - Valuation Informationa Current after-tax cost of debto Total interest-bearing debta Total debt/total assets (%)a Beta Free Cash Flow to Firm in Current Fya Long-term growth rated Risk free rate Average P/E of Peerso Current EPS a Current Shares Outstandinga Current Market Price Per Shared Market risk premium $ 1.09% $136.2 milliona 10.13% 0.550 $321.4 milliona 3% 2.50% 41.100 0.700 576.43 million sharesa 25.450 4.72% $ $ $ 8 $ $ $ 8 Fisher & Paykel Working Capital Management Informationa Net sales $1263.7 milliona Cost of goods sold a $366.9 milliona Inventory a $146.5 milliona Accounts receivable a $223.3 milliona Accounts payable a $69.3 milliona $ 8 T


