

Answered step by step
Verified Expert Solution
Question
1 Approved Answer
1.What is the stock value based on the three-state dividend discount model? 2.What is the stock value based on the constant dividend growth model? Professor
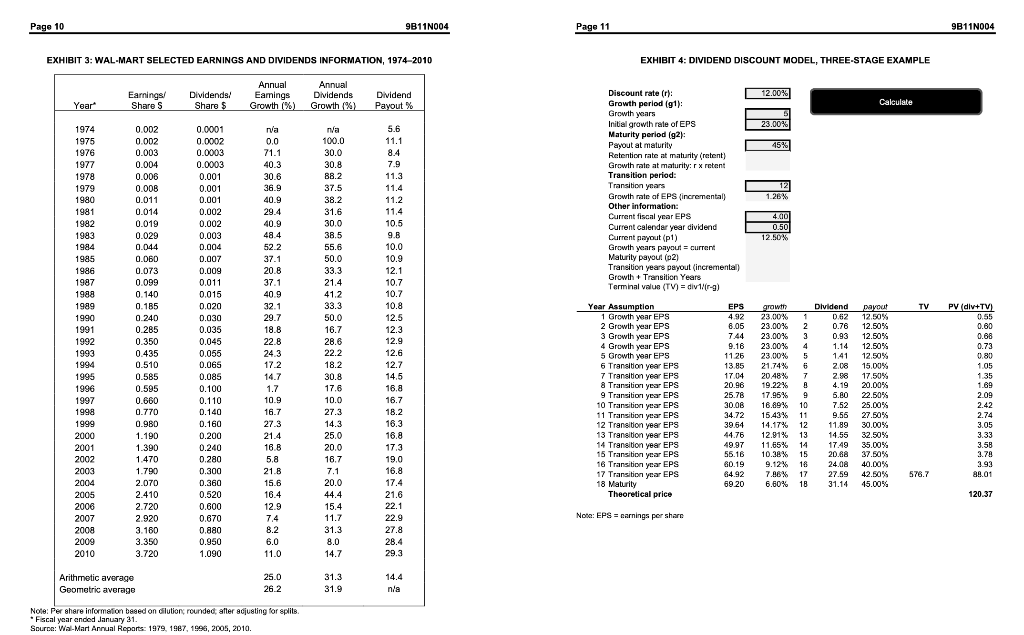
1.What is the stock value based on the three-state dividend discount model?
2.What is the stock value based on the constant dividend growth model?
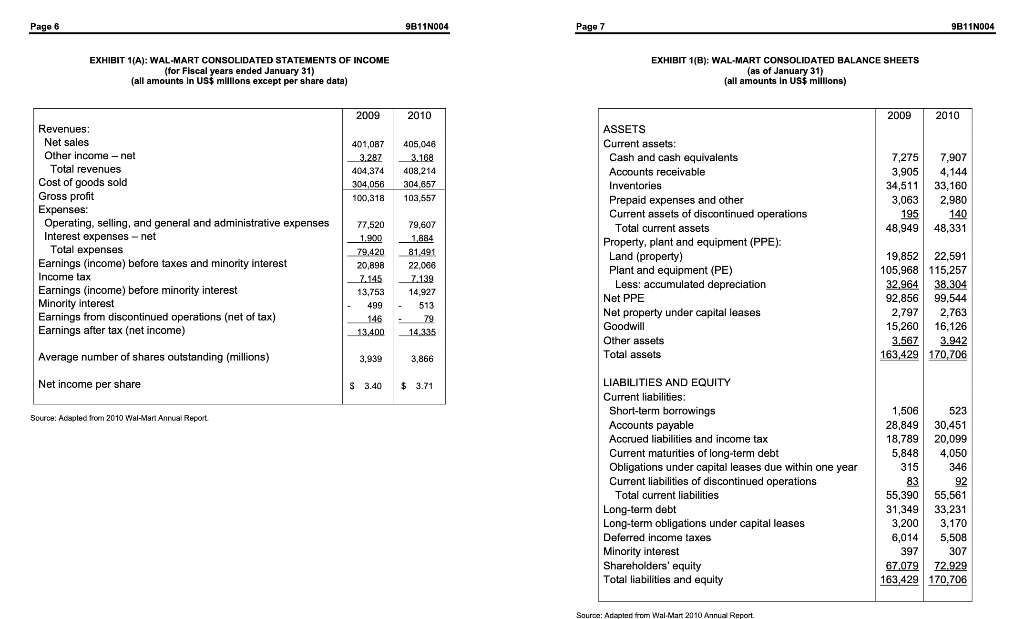
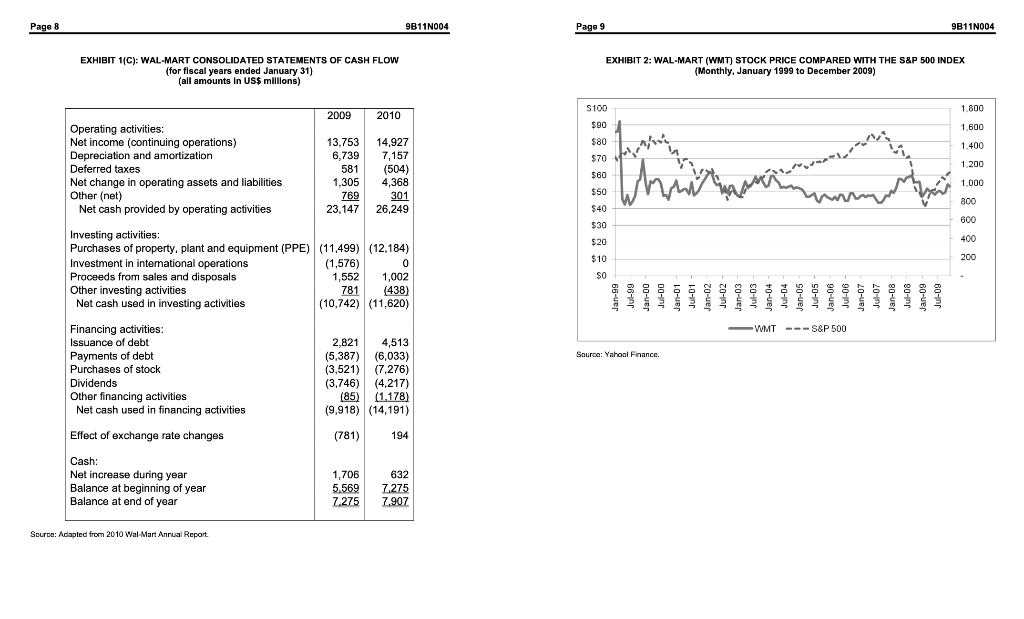
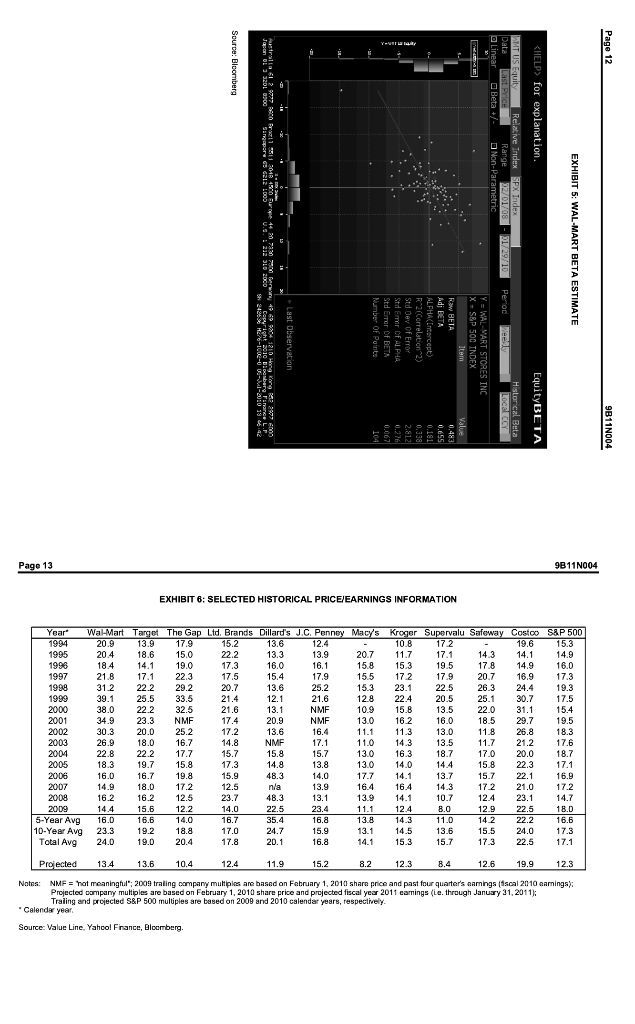
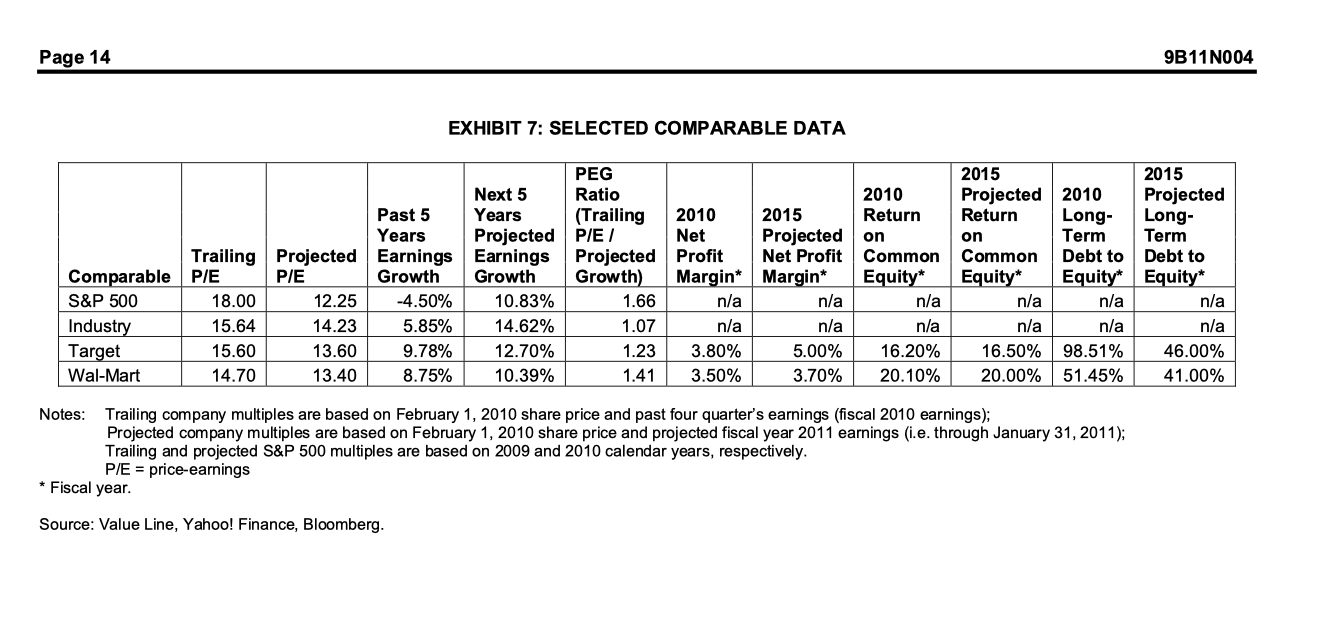
Professor Stephen R. Foerster wrote this case (updated by Cyrus Zahedi under the supervision of Professor Jim Hatch) solely to provide material for class discussion. The authors do not intend to illustrate either effective or ineffective handling of a managerial situation. The authors may have disguised certain names and other identifying information to protect confidentiality. This publication may not be transmitted, photocopied, digitized or otherwise reproduced in any form or by any means without the permission of the copyright holder. Reproduction of this material is not covered under authorization by any reproduction rights organization. To order copies or request permission to reproduce materials, contact lvey Publishing, Ivey Business School, Western University, London, Ontario, Canada, N6G ON1; (t) 519.661.3208; (e) cases@ivey.ca; www.iveycases.com. Copyright @ 2011, Richard Ivey School of Business Foundation Version: 2020-04-07 In early February 2010, Sabrina Gupta, an investment advisor with a major brokerage firm, was examining Wal-Mart Stores, Inc. (Wal-Mart) stock and its valuation. Gupta wondered whether to recommend the stock to any of her new clients or to existing clients who did not currently have Wal-Mart in their portfolios. BACKGROUND OF WAL-MART STORES, INC. Based in Bentonville, Arkansas, and founded by the legendary Sam Walton, Wal-Mart was the world's largest retailer, operating more than 8,400 stores worldwide, including stores in all 50 states; international stores in Argentina, Brazil, Canada, Germany, Mexico, Puerto Rico, South Korea, the United Kingdom; joint venture agreements in China and a stake in a leading Japanese retail chain. Worldwide, Wal-Mart had 2.1 million employees (known as "associates"), who served more than 200 million customers each week. During the fiscal year ended January 31, 2010, Wal-Mart's net sales were more than US 405 billion. Exhibit 1 presents a summary of Wal-Mart's 2009 and 2010 financial statements. Wal-Mart's strategy was to provide a broad assortment of quality merchandise and services at "everyday low prices." It was best known for its discount stores, which offered merchandise such as apparel, small appliances, housewares, electronics and hardware, but also ran combined discount and grocery stores (Wal-Mart Supercenters), membership-only warehouse stores (SAM'S Club) and smaller grocery stores (Neighborhood Markets). In the general merchandise area, Wal-Mart's competitors included Sears and Target. In terms of specialty retailers, its competitors included Gap and Limited. Department store competitors included Dillard's, Macy's and J.C. Penney. Grocery store competitors included Kroger, Supervalu and Safeway. The major membership-only warehouse competitor was Costco Wholesale. Wal-Mart became a publicly traded firm in 1970 with an initial stock price of $16.50 per share and subsequently, in March 1974, declared its first cash dividend of $0.05 per share (after two two-for-one Page 2 EXHIBIT 1(A): WAL-MART CONSOLIDATED STATEMENTS OF INCOME EXHIBIT 1(B): WAL-MART CONSOLIDATED BALANCE SHEETS (for Fiscal years ended January 31) (as of January 31) (all amounts in US\$ millilons except per share data) (all amounts in US\$ millilons) Source: Adapted from 2010 Wol-Mart Anrual Report. EXHIBIT 1(C): WAL-MART CONSOLIDATED STATEMENTS OF CASH FLOW EXHIBIT 2: WAL-MART (WMT) STOCK PRICE COMPARED WITH THE S\&P 500 INDEX (for flscal years ended January 31) (Monthly, January 1999 to December 2009) (all amounts in US\$ milllons) Saurce: Yahoul Finnnce. EXHIBIT 3: WAL-MART SELECTED EARNINGS AND DIVIDENDS INFORMATION, 1974-2010 EXHIBIT 4: DIVIDEND DISCOUNT MODEL, THREE-STAGE EXAMPLE Nowa: EPS = narnings per sharn Note: Per ghare informafion based an clution, roundec, after gcjuating for splits. - Fiscal yoar andod January 31. Sourse: Wial-Mart Annual Reparts: 1979, 1987, 19es, 2005, 2010. EXHIBIT 6: SELECTED HISTORICAL PRICEIEARNINGS INFORMATION Natns: NMF = hat moaningtul*; 2009 traling company multiples are basad an Fabruary 1, 2010 share price and past four quarter's anrnings (fsoal 2010 anrnings); Prejected company multiples are based on February 1, 2010 share price and prejected fiscal year 2011 eamings (ie. thraugh January 31,2011 ); Traling and projected S\&P 500 multiples are based on 2008 and 2010 calendar years, respectioely. - Calender year. Source: Value Line, Yahcol France, Blocmberg. EXHIBIT 7: SELECTED COMPARABLE DATA otes: Trailing company multiples are based on February 1, 2010 share price and past four quarter's earnings (fiscal 2010 earnings); Projected company multiples are based on February 1, 2010 share price and projected fiscal year 2011 earnings (i.e. through January 31,2011 ); Trailing and projected S\&P 500 multiples are based on 2009 and 2010 calendar years, respectively. P/E= price-earnings Fiscal year. ource: Value Line, Yahoo! Finance, Bloomberg. Professor Stephen R. Foerster wrote this case (updated by Cyrus Zahedi under the supervision of Professor Jim Hatch) solely to provide material for class discussion. The authors do not intend to illustrate either effective or ineffective handling of a managerial situation. The authors may have disguised certain names and other identifying information to protect confidentiality. This publication may not be transmitted, photocopied, digitized or otherwise reproduced in any form or by any means without the permission of the copyright holder. Reproduction of this material is not covered under authorization by any reproduction rights organization. To order copies or request permission to reproduce materials, contact lvey Publishing, Ivey Business School, Western University, London, Ontario, Canada, N6G ON1; (t) 519.661.3208; (e) cases@ivey.ca; www.iveycases.com. Copyright @ 2011, Richard Ivey School of Business Foundation Version: 2020-04-07 In early February 2010, Sabrina Gupta, an investment advisor with a major brokerage firm, was examining Wal-Mart Stores, Inc. (Wal-Mart) stock and its valuation. Gupta wondered whether to recommend the stock to any of her new clients or to existing clients who did not currently have Wal-Mart in their portfolios. BACKGROUND OF WAL-MART STORES, INC. Based in Bentonville, Arkansas, and founded by the legendary Sam Walton, Wal-Mart was the world's largest retailer, operating more than 8,400 stores worldwide, including stores in all 50 states; international stores in Argentina, Brazil, Canada, Germany, Mexico, Puerto Rico, South Korea, the United Kingdom; joint venture agreements in China and a stake in a leading Japanese retail chain. Worldwide, Wal-Mart had 2.1 million employees (known as "associates"), who served more than 200 million customers each week. During the fiscal year ended January 31, 2010, Wal-Mart's net sales were more than US 405 billion. Exhibit 1 presents a summary of Wal-Mart's 2009 and 2010 financial statements. Wal-Mart's strategy was to provide a broad assortment of quality merchandise and services at "everyday low prices." It was best known for its discount stores, which offered merchandise such as apparel, small appliances, housewares, electronics and hardware, but also ran combined discount and grocery stores (Wal-Mart Supercenters), membership-only warehouse stores (SAM'S Club) and smaller grocery stores (Neighborhood Markets). In the general merchandise area, Wal-Mart's competitors included Sears and Target. In terms of specialty retailers, its competitors included Gap and Limited. Department store competitors included Dillard's, Macy's and J.C. Penney. Grocery store competitors included Kroger, Supervalu and Safeway. The major membership-only warehouse competitor was Costco Wholesale. Wal-Mart became a publicly traded firm in 1970 with an initial stock price of $16.50 per share and subsequently, in March 1974, declared its first cash dividend of $0.05 per share (after two two-for-one Page 2 EXHIBIT 1(A): WAL-MART CONSOLIDATED STATEMENTS OF INCOME EXHIBIT 1(B): WAL-MART CONSOLIDATED BALANCE SHEETS (for Fiscal years ended January 31) (as of January 31) (all amounts in US\$ millilons except per share data) (all amounts in US\$ millilons) Source: Adapted from 2010 Wol-Mart Anrual Report. EXHIBIT 1(C): WAL-MART CONSOLIDATED STATEMENTS OF CASH FLOW EXHIBIT 2: WAL-MART (WMT) STOCK PRICE COMPARED WITH THE S\&P 500 INDEX (for flscal years ended January 31) (Monthly, January 1999 to December 2009) (all amounts in US\$ milllons) Saurce: Yahoul Finnnce. EXHIBIT 3: WAL-MART SELECTED EARNINGS AND DIVIDENDS INFORMATION, 1974-2010 EXHIBIT 4: DIVIDEND DISCOUNT MODEL, THREE-STAGE EXAMPLE Nowa: EPS = narnings per sharn Note: Per ghare informafion based an clution, roundec, after gcjuating for splits. - Fiscal yoar andod January 31. Sourse: Wial-Mart Annual Reparts: 1979, 1987, 19es, 2005, 2010. EXHIBIT 6: SELECTED HISTORICAL PRICEIEARNINGS INFORMATION Natns: NMF = hat moaningtul*; 2009 traling company multiples are basad an Fabruary 1, 2010 share price and past four quarter's anrnings (fsoal 2010 anrnings); Prejected company multiples are based on February 1, 2010 share price and prejected fiscal year 2011 eamings (ie. thraugh January 31,2011 ); Traling and projected S\&P 500 multiples are based on 2008 and 2010 calendar years, respectioely. - Calender year. Source: Value Line, Yahcol France, Blocmberg. EXHIBIT 7: SELECTED COMPARABLE DATA otes: Trailing company multiples are based on February 1, 2010 share price and past four quarter's earnings (fiscal 2010 earnings); Projected company multiples are based on February 1, 2010 share price and projected fiscal year 2011 earnings (i.e. through January 31,2011 ); Trailing and projected S\&P 500 multiples are based on 2009 and 2010 calendar years, respectively. P/E= price-earnings Fiscal year. ource: Value Line, Yahoo! Finance, BloombergStep by Step Solution
There are 3 Steps involved in it
Step: 1

Get Instant Access to Expert-Tailored Solutions
See step-by-step solutions with expert insights and AI powered tools for academic success
Step: 2

Step: 3
Ace Your Homework with AI
Get the answers you need in no time with our AI-driven, step-by-step assistance
Get Started
Contemporary Issues In Behavioral Finance
Authors: Simon Grima
1st Edition
1787698823, 978-1787698826