Answered step by step
Verified Expert Solution
Question
1 Approved Answer
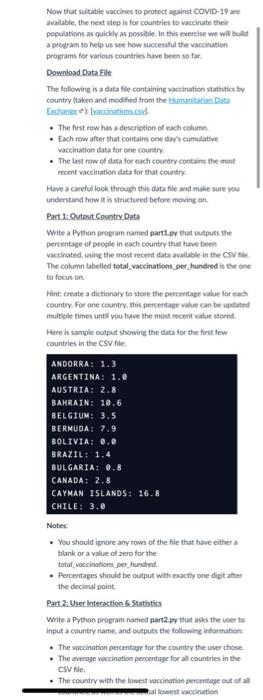
1-Write a Python program named part1.py that outputs the percentage of people in each country that have been vaccinated, using the most recent data available
1-Write a Python program named part1.py that outputs the percentage of people in each country that have been vaccinated, using the most recent data available in the CSV file. The column labelled total_vaccinations_per_hundred is the one to focus on.
Hint: create a dictionary to store the percentage value for each country. For one country, this percentage value can be updated multiple times until you have the most recent value stored.
Here is sample output showing the data for the first few countries in the CSV file:
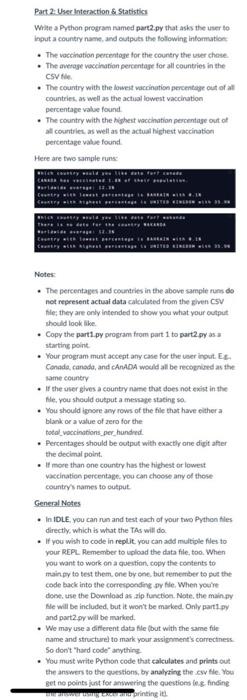
2-Write a Python program named part2.py that asks the user to input a country name, and outputs the following information:
The vaccination percentage for the country the user chose.
The average vaccination percentage for all countries in the CSV file.
The country with the lowest vaccination percentage out of all countries, as well as the actual lowest vaccination percentage value found.
The country with the highest vaccination percentage out of all countries, as well as the actual highest vaccination percentage value found.


CSV FILE:
Now that suitable vaccines to protect against COVID-19 available, the next step is for countries to vaccinate their populations as quickly as possible in this exercise we will bud a program to help us see how success the vaccination programs for various countries have been so far. Download Data File The following is a data file containing vaccination statistics by country (taken and modified from the umanitarian Dita Exchange Pascal The first row has a description of each column Each row after that contains one day's cumulative vaccination data for one country . The last row of data for each country contains the most recent vaccination data for that country Have a careful took through this data tle and make sure you understand how it is structured before moving on Part 1: Output Country Data Write a Python program named parti.py that outputs the percentage of people in each country that have been vaccinated, using the most recent data available in the CSV The column labelled total vaccinations_per_hundred is the one to focus on Hint.create a dictionary to store the percentage value for each country. For one country, this percentage value can be updated multiple times until you have the most recent value stored Here is sample output showing the data for the first few countries in the CSV file ANDORRA: 1.3 ARGENTINA: 1.2 AUSTRIA: 2.8 BAHRAIN: 10.6 BELGIUM: 3.5 BERMUDA: 7.9 BOLIVIA: 2.0 BRAZIL: 1.4 BULGARIA: 0.8 CANADA: 2.8 CAYMAN ISLANDS: 16.8 CHILE: 3.2 Notes: . You should ignore any rows of the file that have either a blank or a value of zero for the total vaccinations per hundred Percentages should be output with eactly one digitalter the decimal point Part 2: User Interaction & Statistics Write a Python program named part2.py that asks the user to Input a country name, and outputs the following information . The vaccination percentage for the country the user those The average vaccination percentage for all countries in the CSV file The country with the lowest vaccination percentage out of hallowest vaccination Part 2: User Interaction & Statistics Wita Python program named part2.py that asks the user to Input a country name and outputs the following information The vaccination percentage for the country the user chose The average vaccination percentage for all countries in the CSV . The country with the lowest vaccination percentage out of all countries, as well as the actual lowest vaccination percentage value found . The country with the highest vaccination percentage out of all countries as well as the actual Highest vaccination percentage value found Here are two sample runs TER BEER IN JA .. . The percentages and countries in the above sample runs do not represent actual data calculated from the given CSV hle: they are only intended to show you what your output should look like Copy the parti.py program from part 1 to part2.py as 3 starting point Your program must accept any case for the user input. Et Conade, canada, and CANADA would all be recognised as the same country the user gives a country me that does not exist in the le, you should output a message stating sa . You should ignore any rows of the file that have either a blank or a value of zero for the total vaccinations per hundred Percentages should be output with exactly ane digitalter the decimal point . If more than one country has the highest or lowest vaccination percentage, you can choose any of those country's names to output General Notes In IDLE, you can run and test each of your two Python les directly, which is what the TAs will do . If you wish to code in replit, you can add multiple files to Your REPL Remember to upload the data file, too. When you want to work on a question copy the contents to main py to test them one by one, but remember to put the code back into the corresponding by When you're done, use the Download as zip function. Note the main py Nie will be included, but it won't be marked. Only party and part2.py will be marked . We may use a different data file (but with the same file name and structure to mark your assignment's correctness So don't hard code anything . You must write Python code that calculates and prints out the answers to the questions, by analyzing the .csv file. You Bet no points just for answering the questions to finding printing Now that suitable vaccines to protect against COVID-19 available, the next step is for countries to vaccinate their populations as quickly as possible in this exercise we will bud a program to help us see how success the vaccination programs for various countries have been so far. Download Data File The following is a data file containing vaccination statistics by country (taken and modified from the umanitarian Dita Exchange Pascal The first row has a description of each column Each row after that contains one day's cumulative vaccination data for one country . The last row of data for each country contains the most recent vaccination data for that country Have a careful took through this data tle and make sure you understand how it is structured before moving on Part 1: Output Country Data Write a Python program named parti.py that outputs the percentage of people in each country that have been vaccinated, using the most recent data available in the CSV The column labelled total vaccinations_per_hundred is the one to focus on Hint.create a dictionary to store the percentage value for each country. For one country, this percentage value can be updated multiple times until you have the most recent value stored Here is sample output showing the data for the first few countries in the CSV file ANDORRA: 1.3 ARGENTINA: 1.2 AUSTRIA: 2.8 BAHRAIN: 10.6 BELGIUM: 3.5 BERMUDA: 7.9 BOLIVIA: 2.0 BRAZIL: 1.4 BULGARIA: 0.8 CANADA: 2.8 CAYMAN ISLANDS: 16.8 CHILE: 3.2 Notes: . You should ignore any rows of the file that have either a blank or a value of zero for the total vaccinations per hundred Percentages should be output with eactly one digitalter the decimal point Part 2: User Interaction & Statistics Write a Python program named part2.py that asks the user to Input a country name, and outputs the following information . The vaccination percentage for the country the user those The average vaccination percentage for all countries in the CSV file The country with the lowest vaccination percentage out of hallowest vaccination Part 2: User Interaction & Statistics Wita Python program named part2.py that asks the user to Input a country name and outputs the following information The vaccination percentage for the country the user chose The average vaccination percentage for all countries in the CSV . The country with the lowest vaccination percentage out of all countries, as well as the actual lowest vaccination percentage value found . The country with the highest vaccination percentage out of all countries as well as the actual Highest vaccination percentage value found Here are two sample runs TER BEER IN JA .. . The percentages and countries in the above sample runs do not represent actual data calculated from the given CSV hle: they are only intended to show you what your output should look like Copy the parti.py program from part 1 to part2.py as 3 starting point Your program must accept any case for the user input. Et Conade, canada, and CANADA would all be recognised as the same country the user gives a country me that does not exist in the le, you should output a message stating sa . You should ignore any rows of the file that have either a blank or a value of zero for the total vaccinations per hundred Percentages should be output with exactly ane digitalter the decimal point . If more than one country has the highest or lowest vaccination percentage, you can choose any of those country's names to output General Notes In IDLE, you can run and test each of your two Python les directly, which is what the TAs will do . If you wish to code in replit, you can add multiple files to Your REPL Remember to upload the data file, too. When you want to work on a question copy the contents to main py to test them one by one, but remember to put the code back into the corresponding by When you're done, use the Download as zip function. Note the main py Nie will be included, but it won't be marked. Only party and part2.py will be marked . We may use a different data file (but with the same file name and structure to mark your assignment's correctness So don't hard code anything . You must write Python code that calculates and prints out the answers to the questions, by analyzing the .csv file. You Bet no points just for answering the questions to finding printing https://drive.google.com/file/d/1aZLCV2ITGXd9TceA6cw7Ii8howHJVR6_/view?usp=sharing
Step by Step Solution
There are 3 Steps involved in it
Step: 1

Get Instant Access to Expert-Tailored Solutions
See step-by-step solutions with expert insights and AI powered tools for academic success
Step: 2

Step: 3

Ace Your Homework with AI
Get the answers you need in no time with our AI-driven, step-by-step assistance
Get Started


