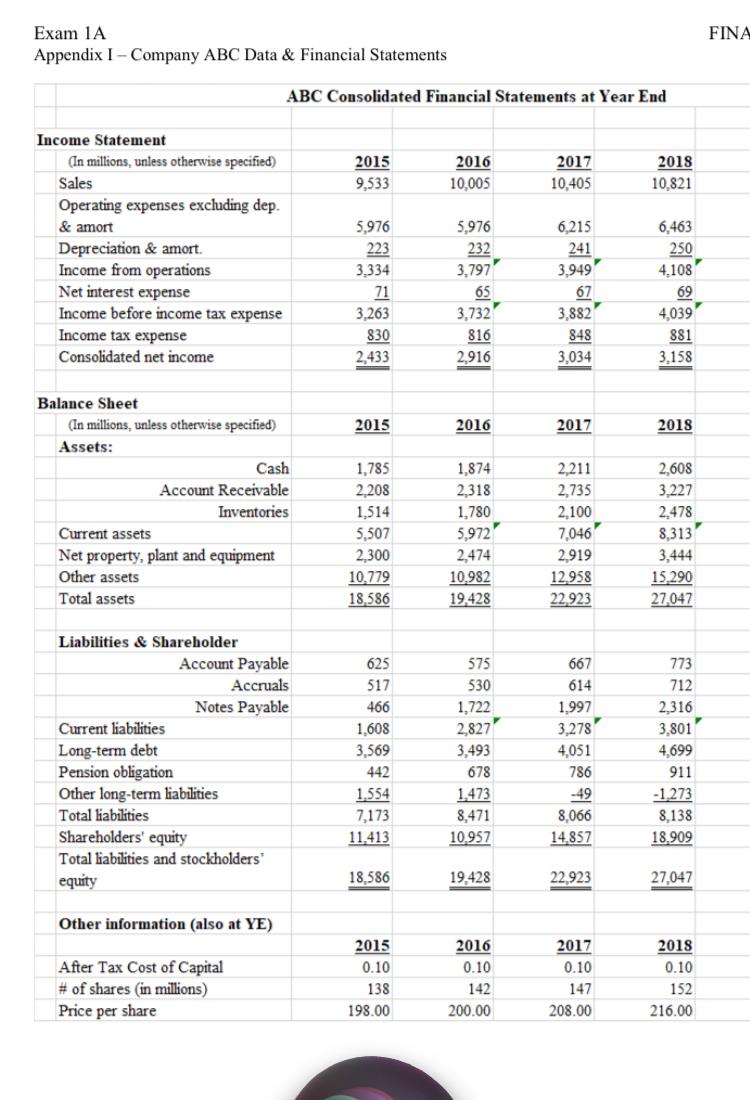
2. 10pt - Compute ABC 2019 free cash flow (FCF). Round the answer to two decimal places. FINA Exam 1A Appendix I - Company ABC Data & Financial Statements ABC Consolidated Financial Statements at Year End 2015 9,533 2016 10,005 2017 10,405 2018 10.821 Income Statement (In millions, unless otherwise specified) Sales Operating expenses excluding dep. & amort Depreciation & amort. Income from operations Net interest expense Income before income tax expense Income tax expense Consolidated net income 5,976 223 3,334 71 3,263 830 2,433 5,976 232 3,797) 65 3,732 816 2,916 6,215 241 3,949 67 6,463 250 4,108 69 4,039 881 3.158 3,882 848 3.034 2015 2016 2017 2018 Balance Sheet (In millions, unless otherwise specified) Assets: Cash Account Receivable Inventories Current assets Net property, plant and equipment Other assets Total assets 2,211 2,735 2,100 2,608 3.227 2,478 1,785 2.208 1,514 5,507 2.300 10.779 18.586 1,874 2.318 1,780 5,972 2,474 10.982 19.428 7,046 8,313 2,919 12,958 22,923 3,444 15,290 27.047 Liabilities & Shareholder Account Payable Accruals Notes Payable Current liabilities Long-term debt Pension obligation Other long-term liabilities Total liabilities Shareholders' equity Total liabilities and stockholders equity 625 517 466 1,608 3,569 442 1.554 7,173 11.413 575 530 1,722 2,827) 3,493 678 1.473 8,471 10.957 667 614 1.997 3,278 4,051 786 -49 8,066 14.857 773 712 2,316 3,801 4,699 911 -1.273 8,138 18.909 18,586 19.428 22.923 27,047 Other information (also at YE) After Tax Cost of Capital # of shares in millions) Price per share 2015 0.10 138 198.00 2016 0.10 142 200.00 2017 0.10 147 2018 0.10 152 216.00 208.00 2. 10pt - Compute ABC 2019 free cash flow (FCF). Round the answer to two decimal places. FINA Exam 1A Appendix I - Company ABC Data & Financial Statements ABC Consolidated Financial Statements at Year End 2015 9,533 2016 10,005 2017 10,405 2018 10.821 Income Statement (In millions, unless otherwise specified) Sales Operating expenses excluding dep. & amort Depreciation & amort. Income from operations Net interest expense Income before income tax expense Income tax expense Consolidated net income 5,976 223 3,334 71 3,263 830 2,433 5,976 232 3,797) 65 3,732 816 2,916 6,215 241 3,949 67 6,463 250 4,108 69 4,039 881 3.158 3,882 848 3.034 2015 2016 2017 2018 Balance Sheet (In millions, unless otherwise specified) Assets: Cash Account Receivable Inventories Current assets Net property, plant and equipment Other assets Total assets 2,211 2,735 2,100 2,608 3.227 2,478 1,785 2.208 1,514 5,507 2.300 10.779 18.586 1,874 2.318 1,780 5,972 2,474 10.982 19.428 7,046 8,313 2,919 12,958 22,923 3,444 15,290 27.047 Liabilities & Shareholder Account Payable Accruals Notes Payable Current liabilities Long-term debt Pension obligation Other long-term liabilities Total liabilities Shareholders' equity Total liabilities and stockholders equity 625 517 466 1,608 3,569 442 1.554 7,173 11.413 575 530 1,722 2,827) 3,493 678 1.473 8,471 10.957 667 614 1.997 3,278 4,051 786 -49 8,066 14.857 773 712 2,316 3,801 4,699 911 -1.273 8,138 18.909 18,586 19.428 22.923 27,047 Other information (also at YE) After Tax Cost of Capital # of shares in millions) Price per share 2015 0.10 138 198.00 2016 0.10 142 200.00 2017 0.10 147 2018 0.10 152 216.00 208.00