

Question
2. [10pts] The file HwAdjSales.xlsx Download HwAdjSales.xlsx gives the annual sales for Microsoft (in millions of dollars). a) Create a new column so that 1992
 2. [10pts] The file HwAdjSales.xlsx Download HwAdjSales.xlsx gives the annual sales for Microsoft (in millions of dollars).
a) Create a new column so that 1992 is year 1. Then create a scatterplot of the Total Adjusted Sales. Add a title, axis labels, etc to create a readable scatterplot. Fit an exponential curve to the data. Display the equation on the scatterplot. Make sure your scatterplot has an accurate title and the x,y axis are labelled.
b) Create a new column that shows the percent growth starting from 1993. As a reminder, percent growth is determined by (new sales - prior sales)/ prior sales. Format your answer as a percentage with one decimal. What is the average percent growth of the company since 1992?
c) Using your exponential model, predict Total Retail Sales revenue for 2025 and 2050.
d) Is the exponential model a good model for this data? Should it be used to model the growth of the company in the long term?
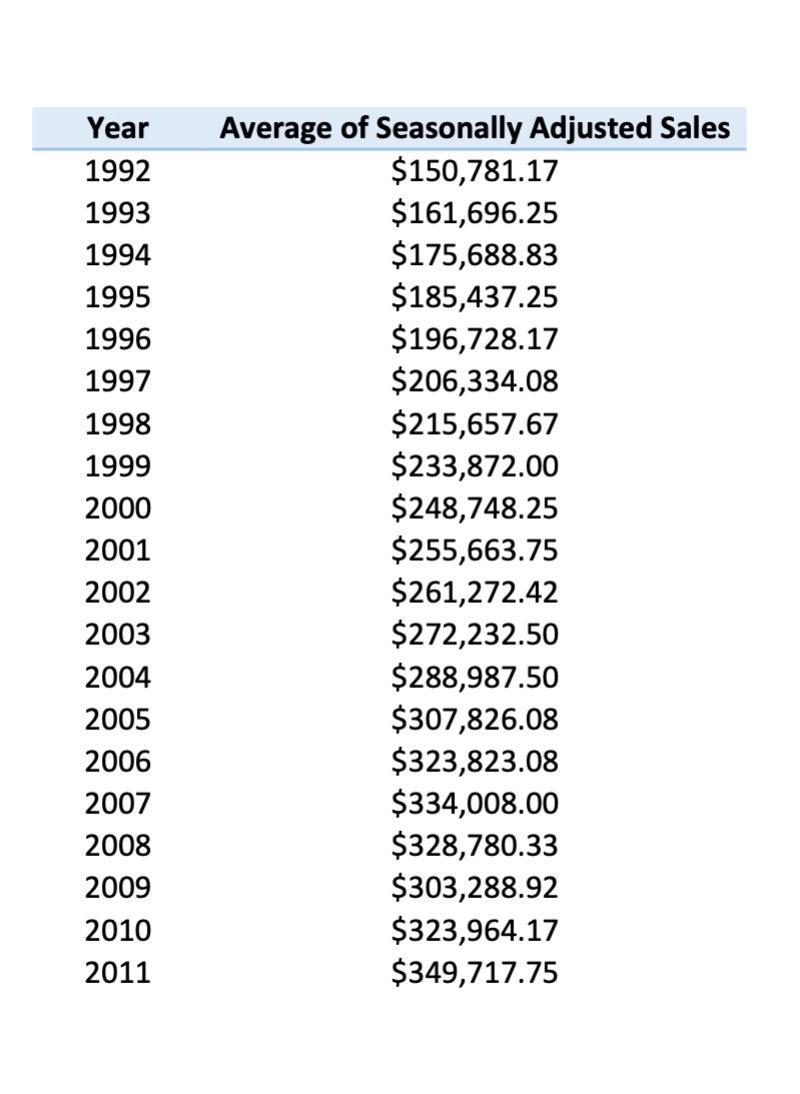
Year19921993199419951996199719981999200020012002200320042005200620072008200920102011AverageofSeasonallyAdjustedSales$150,781.17$161,696.25$175,688.83$185,437.25$196,728.17$206,334.08$215,657.67$233,872.00$248,748.25$255,663.75$261,272.42$272,232.50$288,987.50$307,826.08$323,823.08$334,008.00$328,780.33$303,288.92$323,964.17$349,717.75
Step by Step Solution
There are 3 Steps involved in it
Step: 1

Get Instant Access to Expert-Tailored Solutions
See step-by-step solutions with expert insights and AI powered tools for academic success
Step: 2

Step: 3
Ace Your Homework with AI
Get the answers you need in no time with our AI-driven, step-by-step assistance
Get Started
Mathematical Finance Core Theory Problems And Statistical Algorithms
Authors: Nikolai Dokuchaev
1st Edition
0415414482, 978-0415414487