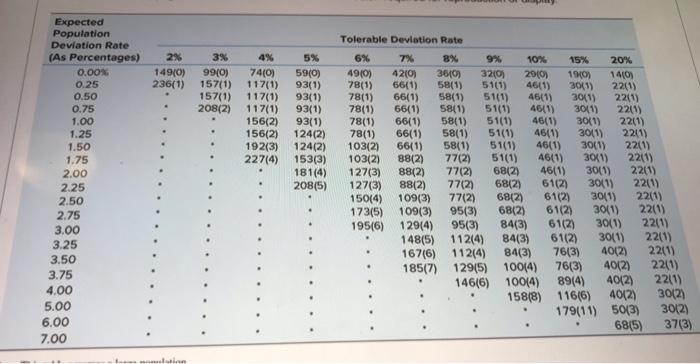
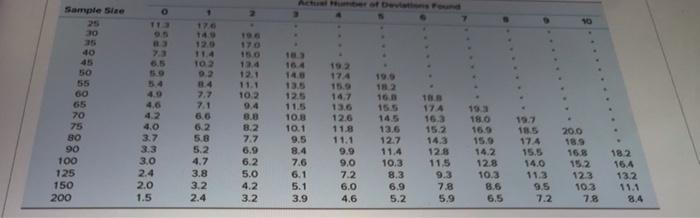
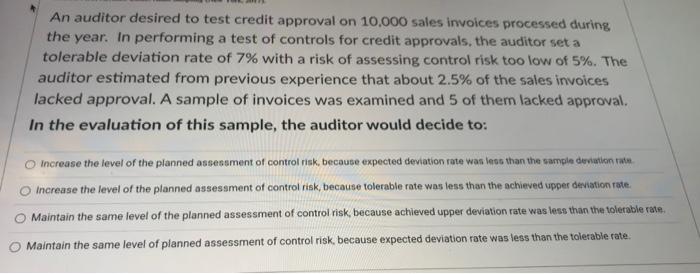
2% 14910) 236(1) 3% 99(0) 157(1) 157(1) 208(2) 78(1) 4% 74(0) 117(1) 117(1) 117(1) 156(2) 156(2) 192(3) 227(4) Expected Population Deviation Rate (As Percentages) 0.00% 0.25 0.50 0.75 1.00 1.25 1.50 1.75 2.00 2.25 2.50 2.75 3.00 3.25 3.50 3.75 4.00 5.00 6.00 7.00 5% 59(0) 93(1) 93(1) 93(1) 93(1) 124(2) 124(2) 153(3) 181(4) 208(5) Tolerable Deviation Rate 6% 7% 8% 9% 10% 15% 20% 4910) 4210) 36109 3210 2910) 100) 1410) 78(1) 66(1) 58(1) 51(1) 46(1) 30(1) 22(1) 66(1) 58(1) 51(1) 46(1) 3041) 221) 78(1) 66(1) 5841) 51(1) 46(1) 3011) 2211) 78(1) 66(1) 58(1) 51(1) 46(1) 3041) 22(1) 78(1) 66(1) 58(1) 51(1) 46(1) 3011) 2211) 103(2) 66(1) 58(1) 51(1) 46(1) 30(1) 22(1) 103(2) 88(2) 77(2) 51(1) 46(1) 3041) 2211) 127(3) 88(2) 77(2) 6812 46(1) 30(1) 22013 127(3) 88(2) 77(2) 6812) 61(2) 3011) 2241) 150(4) 109(3) 77(2) 6812) 6112) 30(1) 221) 173(5) 109(3) 95(3) 6812) 61(2) 301) 22(1) 195(6) 129(4) 95(3) 84(3) 61(2) 30(1) 221) 148(5) 112(4) 84(3) 6112) 30(1) 22(1) 167(6) 112(4) 84(3) 76(3) 40(2) 2241) 4012) 185(7) 129(5) 100(4) 7613) 22(1) 146(6) 100(4) 89(4) 40(2) 2211) 15818) 116(6) 4012) 3012) 179(11) 50(3) 3012) 68(5) 37(3) Sample Size YO 30 TU 9.5 40 73 140 12.0 11.4 TO 02 170 150 12.4 121 11.1 102 192 50 164 14 13. 125 7.7 7.1 19.5 112 160 155 66 19.3 18.0 16.9 60 65 70 75 80 90 100 125 150 200 15.0 4.0 4.0 4.2 4,0 3.7 3.3 3,0 2.4 2.0 1.5 6.2 5.8 5.2 4.7 3.8 3.2 2.4 8.0 8.2 7.7 6.9 6.2 5.0 4.2 3.2 15.0 14,7 13.6 12.6 11.8 11.1 9.9 9,0 7.2 6.0 4.6 10.3 10.1 9.5 8.4 7.6 6.1 5.1 3.9 13.6 12.7 11.4 10.3 8.3 6.9 5.2 174 16.3 15.2 14.3 12.8 11,5 9.3 7.8 5.9 14.2 12.8 10.3 8.6 6.5 197 18.5 174 15.5 14.0 11.3 9.5 7.2 20.0 185 163 15.2 123 103 78 182 15.4 13.2 11.1 8.4 An auditor desired to test credit approval on 10,000 sales invoices processed during the year. In performing a test of controls for credit approvals, the auditor set a tolerable deviation rate of 7% with a risk of assessing control risk too low of 5%. The auditor estimated from previous experience that about 2.5% of the sales invoices lacked approval. A sample of invoices was examined and 5 of them lacked approval. In the evaluation of this sample, the auditor would decide to: Increase the level of the planned assessment of control risk, because expected deviation rate was less than the sample deviation we Increase the level of the planned assessment of control risk, because tolerable rate was less than the achieved upper deviation rate. Maintain the same level of the planned assessment of control risk, because achieved upper deviation rate was less than the tolerable rate. Maintain the same level of planned assessment of control risk, because expected deviation rate was less than the tolerable rate