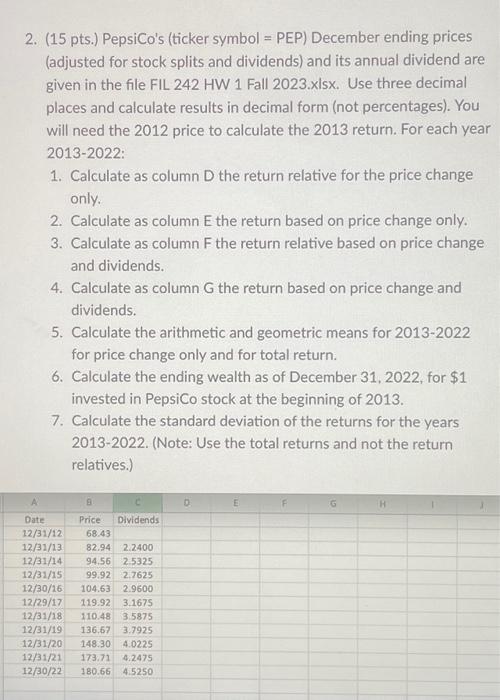
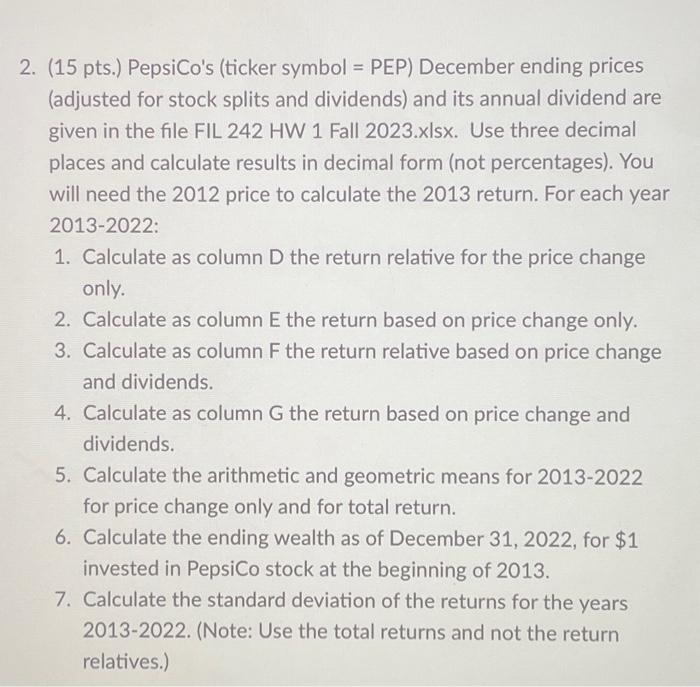
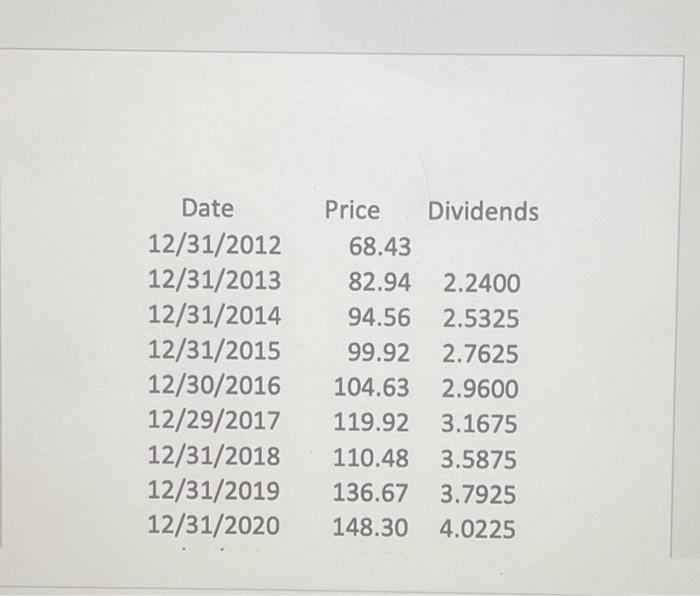
(15 pts.) PepsiCo's (ticker symbol = PEP) December ending prices (adjusted for stock splits and dividends) and its annual dividend are given in the file FIL 242 HW 1 Fall 2023.xlsx. Use three decimal places and calculate results in decimal form (not percentages). You will need the 2012 price to calculate the 2013 return. For each year 2013-2022: 1. Calculate as column D the return relative for the price change only. 2. Calculate as column E the return based on price change only. 3. Calculate as column F the return relative based on price change and dividends. 4. Calculate as column G the return based on price change and dividends. 5. Calculate the arithmetic and geometric means for 2013-2022 for price change only and for total return. 6. Calculate the ending wealth as of December 31, 2022, for $1 invested in PepsiCo stock at the beginning of 2013. 7. Calculate the standard deviation of the returns for the years 2013-2022. (Note: Use the total returns and not the return relatives.) \begin{tabular}{crl} Date & \multicolumn{1}{c}{ Price } & Dividends \\ 12/31/2012 & 68.43 & \\ 12/31/2013 & 82.94 & 2.2400 \\ 12/31/2014 & 94.56 & 2.5325 \\ 12/31/2015 & 99.92 & 2.7625 \\ 12/30/2016 & 104.63 & 2.9600 \\ 12/29/2017 & 119.92 & 3.1675 \\ 12/31/2018 & 110.48 & 3.5875 \\ 12/31/2019 & 136.67 & 3.7925 \\ 12/31/2020 & 148.30 & 4.0225 \end{tabular} 2. (15 pts.) PepsiCo's (ticker symbol = PEP) December ending prices (adjusted for stock splits and dividends) and its annual dividend are given in the file FIL 242 HW 1 Fall 2023.xIsx. Use three decimal places and calculate results in decimal form (not percentages). You will need the 2012 price to calculate the 2013 return. For each year 2013-2022: 1. Calculate as column D the return relative for the price change only. 2. Calculate as column E the return based on price change only. 3. Calculate as column F the return relative based on price change and dividends. 4. Calculate as column G the return based on price change and dividends. 5. Calculate the arithmetic and geometric means for 2013-2022 for price change only and for total return. 6. Calculate the ending wealth as of December 31,2022 , for $1 invested in PepsiCo stock at the beginning of 2013. 7. Calculate the standard deviation of the returns for the years 2013-2022. (Note: Use the total returns and not the return relatives.) (15 pts.) PepsiCo's (ticker symbol = PEP) December ending prices (adjusted for stock splits and dividends) and its annual dividend are given in the file FIL 242 HW 1 Fall 2023.xlsx. Use three decimal places and calculate results in decimal form (not percentages). You will need the 2012 price to calculate the 2013 return. For each year 2013-2022: 1. Calculate as column D the return relative for the price change only. 2. Calculate as column E the return based on price change only. 3. Calculate as column F the return relative based on price change and dividends. 4. Calculate as column G the return based on price change and dividends. 5. Calculate the arithmetic and geometric means for 2013-2022 for price change only and for total return. 6. Calculate the ending wealth as of December 31, 2022, for $1 invested in PepsiCo stock at the beginning of 2013. 7. Calculate the standard deviation of the returns for the years 2013-2022. (Note: Use the total returns and not the return relatives.) \begin{tabular}{crl} Date & \multicolumn{1}{c}{ Price } & Dividends \\ 12/31/2012 & 68.43 & \\ 12/31/2013 & 82.94 & 2.2400 \\ 12/31/2014 & 94.56 & 2.5325 \\ 12/31/2015 & 99.92 & 2.7625 \\ 12/30/2016 & 104.63 & 2.9600 \\ 12/29/2017 & 119.92 & 3.1675 \\ 12/31/2018 & 110.48 & 3.5875 \\ 12/31/2019 & 136.67 & 3.7925 \\ 12/31/2020 & 148.30 & 4.0225 \end{tabular} 2. (15 pts.) PepsiCo's (ticker symbol = PEP) December ending prices (adjusted for stock splits and dividends) and its annual dividend are given in the file FIL 242 HW 1 Fall 2023.xIsx. Use three decimal places and calculate results in decimal form (not percentages). You will need the 2012 price to calculate the 2013 return. For each year 2013-2022: 1. Calculate as column D the return relative for the price change only. 2. Calculate as column E the return based on price change only. 3. Calculate as column F the return relative based on price change and dividends. 4. Calculate as column G the return based on price change and dividends. 5. Calculate the arithmetic and geometric means for 2013-2022 for price change only and for total return. 6. Calculate the ending wealth as of December 31,2022 , for $1 invested in PepsiCo stock at the beginning of 2013. 7. Calculate the standard deviation of the returns for the years 2013-2022. (Note: Use the total returns and not the return relatives.)


