Answered step by step
Verified Expert Solution
Question
1 Approved Answer
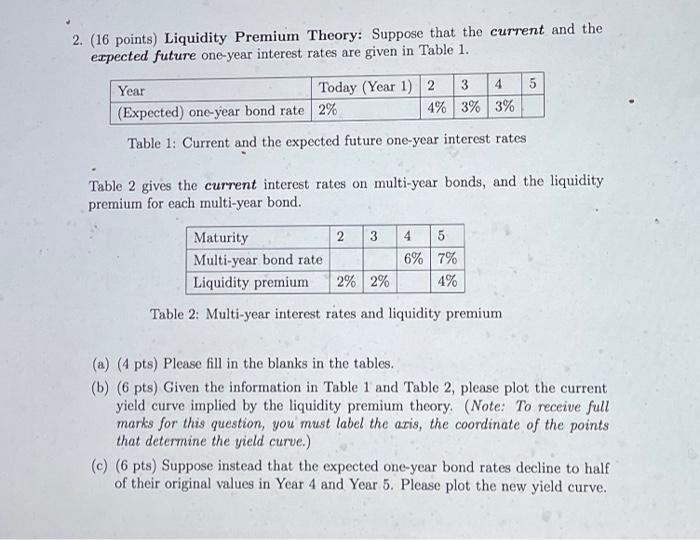
2. (16 points) Liquidity Premium Theory: Suppose that the current and the expected future one-year interest rates are given in Table 1. Today (Year 1)
2. (16 points) Liquidity Premium Theory: Suppose that the current and the expected future one-year interest rates are given in Table 1. Today (Year 1) 2 3 4% 3% 3% Year (Expected) one-year bond rate 2% Table 1: Current and the expected future one-year interest rates 4 5 2 3 Table 2 gives the current interest rates on multi-year bonds, and the liquidity premium for each multi-year bond. 4 5 6% 7% 4% Maturity Multi-year bond rate Liquidity premium 2% 2% Table 2: Multi-year interest rates and liquidity premium (a) (4 pts) Please fill in the blanks in the tables. (b) (6 pts) Given the information in Table 1 and Table 2, please plot the current yield curve implied by the liquidity pr theory. (Note: To receive full marks for this question, you must label the axis, the coordinate of the points that determine the yield curve.) (c) (6 pts) Suppose instead that the expected one-year bond rates decline to half of their original values in Year 4 and Year 5. Please plot the new yield curve.

Step by Step Solution
There are 3 Steps involved in it
Step: 1

Get Instant Access to Expert-Tailored Solutions
See step-by-step solutions with expert insights and AI powered tools for academic success
Step: 2

Step: 3

Ace Your Homework with AI
Get the answers you need in no time with our AI-driven, step-by-step assistance
Get Started


