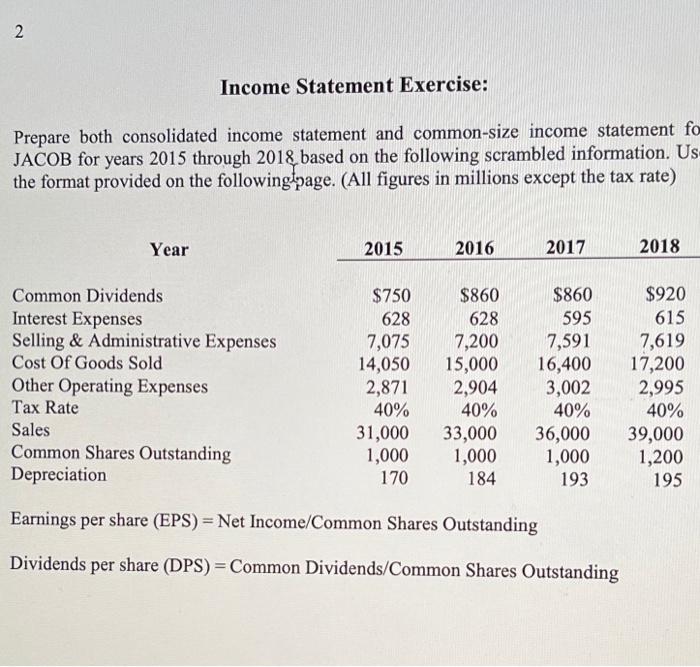
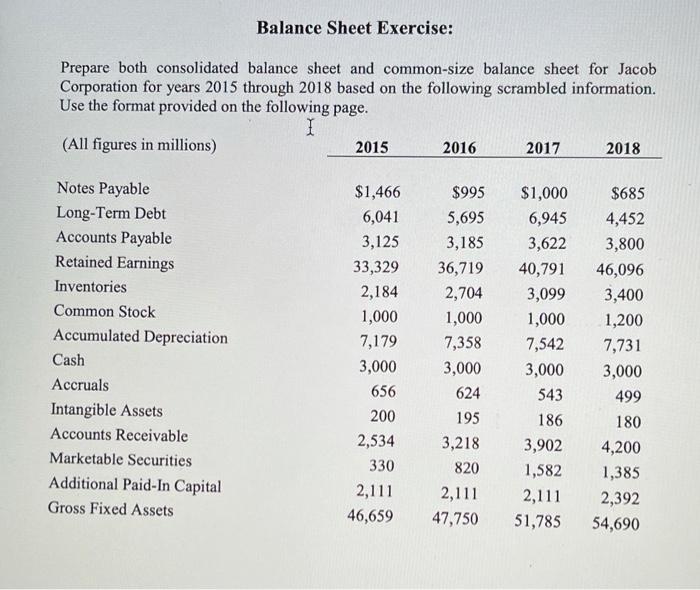
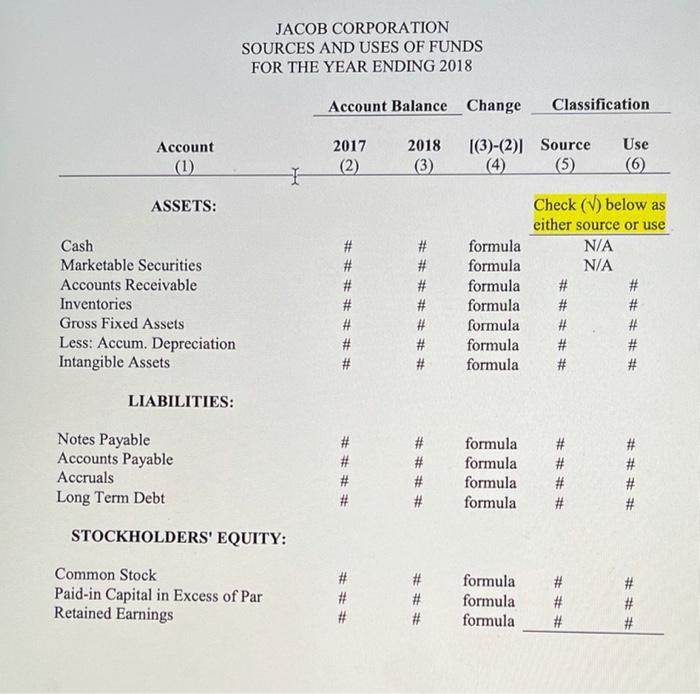
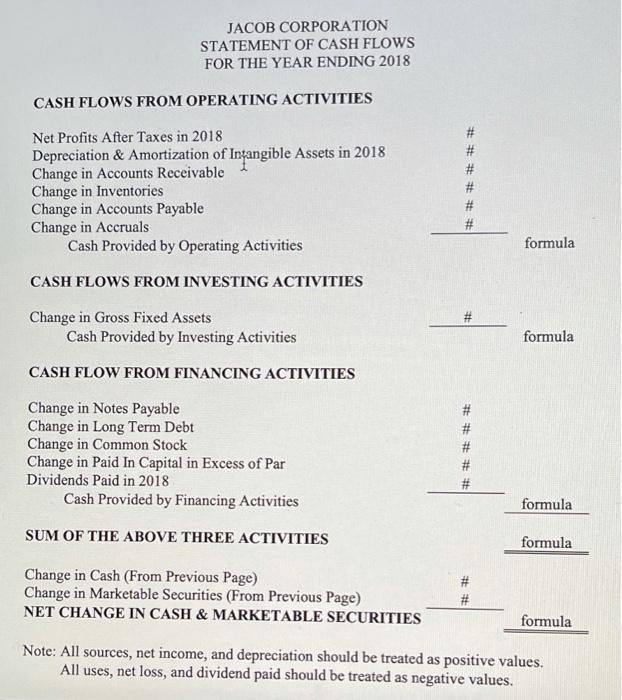
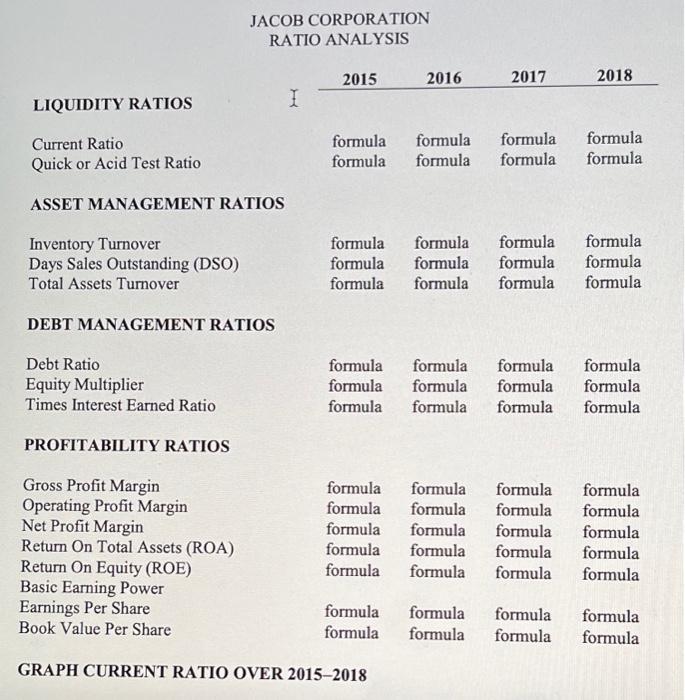
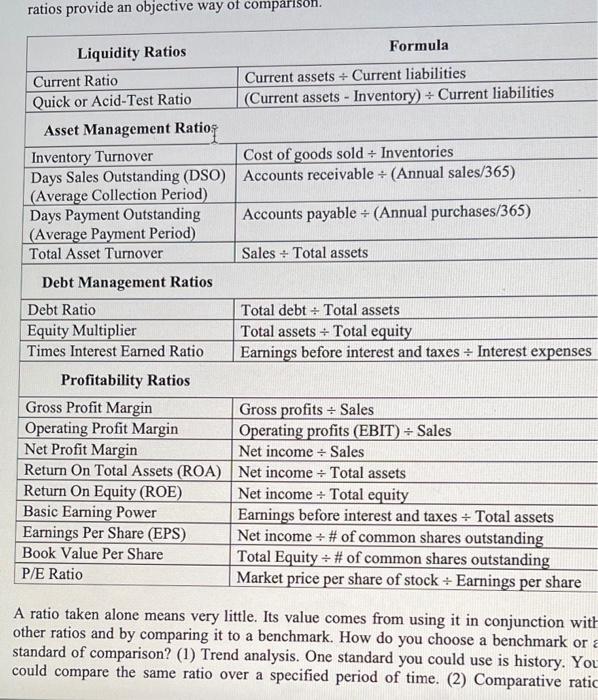
2 2 Income Statement Exercise: Prepare both consolidated income statement and common-size income statement fo JACOB for years 2015 through 2018 based on the following scrambled information. Us the format provided on the following page. (All figures in millions except the tax rate) Year 2015 2016 2017 2018 Common Dividends Interest Expenses Selling & Administrative Expenses Cost Of Goods Sold Other Operating Expenses Tax Rate Sales Common Shares Outstanding Depreciation $750 628 7,075 14,050 2,871 40% 31,000 1,000 170 $860 628 7,200 15,000 2,904 40% 33,000 1,000 184 $860 595 7,591 16,400 3,002 40% 36,000 1,000 193 $920 615 7,619 17,200 2,995 40% 39,000 1,200 195 Earnings per share (EPS) = Net Income/Common Shares Outstanding Dividends per share (DPS) = Common Dividends/Common Shares Outstanding Balance Sheet Exercise: Prepare both consolidated balance sheet and common-size balance sheet for Jacob Corporation for years 2015 through 2018 based on the following scrambled information. Use the format provided on the following page. I (All figures in millions) 2015 2016 2017 2018 $1,466 $995 $685 $1,000 6,945 6,041 Notes Payable Long-Term Debt Accounts Payable Retained Earnings 5,695 4,452 3,800 3,125 3,185 3,622 40,791 Inventories 33,329 2,184 36,719 2,704 46,096 3,400 3,099 Common Stock 1,000 1,000 1,000 1,200 Accumulated Depreciation Cash 7,179 7,358 7,542 7,731 3,000 3,000 3,000 3,000 Accruals 656 624 543 499 Intangible Assets 200 195 186 180 Accounts Receivable 2,534 3,218 3,902 4,200 Marketable Securities 330 820 1,582 1,385 Additional Paid-In Capital Gross Fixed Assets 2,111 2,111 46,659 2,111 47,750 2,392 51,785 54,690 JACOB CORPORATION SOURCES AND USES OF FUNDS FOR THE YEAR ENDING 2018 Account Balance Change Classification Account 2017 (2) 2018 (3) |(3)-(2) Source (5) Use 6 ASSETS: Cash Marketable Securities Accounts Receivable Inventories Gross Fixed Assets Less: Accum. Depreciation Intangible Assets # Check (6) below as either source or use N/A N/A # # formula formula formula formula formula formula formula ##### ##### LIABILITIES: Notes Payable Accounts Payable Accruals Long Term Debt #### formula formula formula formula #### STOCKHOLDERS' EQUITY: Common Stock Paid-in Capital in Excess of Par Retained Earnings ### ### formula formula formula # ### JACOB CORPORATION STATEMENT OF CASH FLOWS FOR THE YEAR ENDING 2018 CASH FLOWS FROM OPERATING ACTIVITIES Net Profits After Taxes in 2018 Depreciation & Amortization of Intangible Assets in 2018 Change in Accounts Receivable Change in Inventories Change in Accounts Payable Change in Accruals Cash Provided by Operating Activities ## ### formula CASH FLOWS FROM INVESTING ACTIVITIES # Change in Gross Fixed Assets Cash Provided by Investing Activities formula CASH FLOW FROM FINANCING ACTIVITIES Change in Notes Payable Change in Long Term Debt Change in Common Stock Change in Paid In Capital in Excess of Par Dividends Paid in 2018 Cash Provided by Financing Activities #### formula SUM OF THE ABOVE THREE ACTIVITIES formula # Change in Cash (From Previous Page) Change in Marketable Securities (From Previous Page) NET CHANGE IN CASH & MARKETABLE SECURITIES formula Note: All sources, net income, and depreciation should be treated as positive values. All uses, net loss, and dividend paid should be treated as negative values. JACOB CORPORATION RATIO ANALYSIS 2015 2016 2017 2018 LIQUIDITY RATIOS I Current Ratio Quick or Acid Test Ratio formula formula formula formula formula formula formula formula ASSET MANAGEMENT RATIOS Inventory Turnover Days Sales Outstanding (DSO) Total Assets Turnover formula formula formula formula formula formula formula formula formula formula formula formula DEBT MANAGEMENT RATIOS Debt Ratio Equity Multiplier Times Interest Earned Ratio formula formula formula formula formula formula formula formula formula formula formula formula PROFITABILITY RATIOS Gross Profit Margin Operating Profit Margin Net Profit Margin Return On Total Assets (ROA) Return On Equity (ROE) Basic Earning Power Earnings Per Share Book Value Per Share formula formula formula formula formula formula formula formula formula formula formula formula formula formula formula formula formula formula formula formula formula formula formula formula formula formula formula formula GRAPH CURRENT RATIO OVER 20152018 ratios provide an objective way of comparison Liquidity Ratios Formula Current Ratio Current assets + Current liabilities Quick or Acid-Test Ratio (Current assets - Inventory) + Current liabilities Asset Management Ratio: Inventory Turnover Cost of goods sold + Inventories Days Sales Outstanding (DSO) Accounts receivable + (Annual sales/365) (Average Collection Period) Days Payment Outstanding Accounts payable + (Annual purchases/365) (Average Payment Period) Total Asset Turnover Sales + Total assets Debt Management Ratios Debt Ratio Total debt + Total assets Equity Multiplier Total assets + Total equity Times Interest Earned Ratio Earnings before interest and taxes : Interest expenses Profitability Ratios Gross Profit Margin Gross profits : Sales Operating Profit Margin Operating profits (EBIT) = Sales Net Profit Margin Net income + Sales Return On Total Assets (ROA) Net income - Total assets Return On Equity (ROE) Net income + Total equity Basic Earning Power Earnings before interest and taxes + Total assets Earnings Per Share (EPS) Net income + # of common shares outstanding Book Value Per Share Total Equity + # of common shares outstanding P/E Ratio Market price per share of stock + Earnings per share A ratio taken alone means very little. Its value comes from using it in conjunction with other ratios and by comparing it to a benchmark. How do you choose a benchmark or a standard of comparison? (1) Trend analysis. One standard you could use is history. You could compare the same ratio over a specified period of time. (2) Comparative ratic 2 2 Income Statement Exercise: Prepare both consolidated income statement and common-size income statement fo JACOB for years 2015 through 2018 based on the following scrambled information. Us the format provided on the following page. (All figures in millions except the tax rate) Year 2015 2016 2017 2018 Common Dividends Interest Expenses Selling & Administrative Expenses Cost Of Goods Sold Other Operating Expenses Tax Rate Sales Common Shares Outstanding Depreciation $750 628 7,075 14,050 2,871 40% 31,000 1,000 170 $860 628 7,200 15,000 2,904 40% 33,000 1,000 184 $860 595 7,591 16,400 3,002 40% 36,000 1,000 193 $920 615 7,619 17,200 2,995 40% 39,000 1,200 195 Earnings per share (EPS) = Net Income/Common Shares Outstanding Dividends per share (DPS) = Common Dividends/Common Shares Outstanding Balance Sheet Exercise: Prepare both consolidated balance sheet and common-size balance sheet for Jacob Corporation for years 2015 through 2018 based on the following scrambled information. Use the format provided on the following page. I (All figures in millions) 2015 2016 2017 2018 $1,466 $995 $685 $1,000 6,945 6,041 Notes Payable Long-Term Debt Accounts Payable Retained Earnings 5,695 4,452 3,800 3,125 3,185 3,622 40,791 Inventories 33,329 2,184 36,719 2,704 46,096 3,400 3,099 Common Stock 1,000 1,000 1,000 1,200 Accumulated Depreciation Cash 7,179 7,358 7,542 7,731 3,000 3,000 3,000 3,000 Accruals 656 624 543 499 Intangible Assets 200 195 186 180 Accounts Receivable 2,534 3,218 3,902 4,200 Marketable Securities 330 820 1,582 1,385 Additional Paid-In Capital Gross Fixed Assets 2,111 2,111 46,659 2,111 47,750 2,392 51,785 54,690 JACOB CORPORATION SOURCES AND USES OF FUNDS FOR THE YEAR ENDING 2018 Account Balance Change Classification Account 2017 (2) 2018 (3) |(3)-(2) Source (5) Use 6 ASSETS: Cash Marketable Securities Accounts Receivable Inventories Gross Fixed Assets Less: Accum. Depreciation Intangible Assets # Check (6) below as either source or use N/A N/A # # formula formula formula formula formula formula formula ##### ##### LIABILITIES: Notes Payable Accounts Payable Accruals Long Term Debt #### formula formula formula formula #### STOCKHOLDERS' EQUITY: Common Stock Paid-in Capital in Excess of Par Retained Earnings ### ### formula formula formula # ### JACOB CORPORATION STATEMENT OF CASH FLOWS FOR THE YEAR ENDING 2018 CASH FLOWS FROM OPERATING ACTIVITIES Net Profits After Taxes in 2018 Depreciation & Amortization of Intangible Assets in 2018 Change in Accounts Receivable Change in Inventories Change in Accounts Payable Change in Accruals Cash Provided by Operating Activities ## ### formula CASH FLOWS FROM INVESTING ACTIVITIES # Change in Gross Fixed Assets Cash Provided by Investing Activities formula CASH FLOW FROM FINANCING ACTIVITIES Change in Notes Payable Change in Long Term Debt Change in Common Stock Change in Paid In Capital in Excess of Par Dividends Paid in 2018 Cash Provided by Financing Activities #### formula SUM OF THE ABOVE THREE ACTIVITIES formula # Change in Cash (From Previous Page) Change in Marketable Securities (From Previous Page) NET CHANGE IN CASH & MARKETABLE SECURITIES formula Note: All sources, net income, and depreciation should be treated as positive values. All uses, net loss, and dividend paid should be treated as negative values. JACOB CORPORATION RATIO ANALYSIS 2015 2016 2017 2018 LIQUIDITY RATIOS I Current Ratio Quick or Acid Test Ratio formula formula formula formula formula formula formula formula ASSET MANAGEMENT RATIOS Inventory Turnover Days Sales Outstanding (DSO) Total Assets Turnover formula formula formula formula formula formula formula formula formula formula formula formula DEBT MANAGEMENT RATIOS Debt Ratio Equity Multiplier Times Interest Earned Ratio formula formula formula formula formula formula formula formula formula formula formula formula PROFITABILITY RATIOS Gross Profit Margin Operating Profit Margin Net Profit Margin Return On Total Assets (ROA) Return On Equity (ROE) Basic Earning Power Earnings Per Share Book Value Per Share formula formula formula formula formula formula formula formula formula formula formula formula formula formula formula formula formula formula formula formula formula formula formula formula formula formula formula formula GRAPH CURRENT RATIO OVER 20152018 ratios provide an objective way of comparison Liquidity Ratios Formula Current Ratio Current assets + Current liabilities Quick or Acid-Test Ratio (Current assets - Inventory) + Current liabilities Asset Management Ratio: Inventory Turnover Cost of goods sold + Inventories Days Sales Outstanding (DSO) Accounts receivable + (Annual sales/365) (Average Collection Period) Days Payment Outstanding Accounts payable + (Annual purchases/365) (Average Payment Period) Total Asset Turnover Sales + Total assets Debt Management Ratios Debt Ratio Total debt + Total assets Equity Multiplier Total assets + Total equity Times Interest Earned Ratio Earnings before interest and taxes : Interest expenses Profitability Ratios Gross Profit Margin Gross profits : Sales Operating Profit Margin Operating profits (EBIT) = Sales Net Profit Margin Net income + Sales Return On Total Assets (ROA) Net income - Total assets Return On Equity (ROE) Net income + Total equity Basic Earning Power Earnings before interest and taxes + Total assets Earnings Per Share (EPS) Net income + # of common shares outstanding Book Value Per Share Total Equity + # of common shares outstanding P/E Ratio Market price per share of stock + Earnings per share A ratio taken alone means very little. Its value comes from using it in conjunction with other ratios and by comparing it to a benchmark. How do you choose a benchmark or a standard of comparison? (1) Trend analysis. One standard you could use is history. You could compare the same ratio over a specified period of time. (2) Comparative ratic
