Answered step by step
Verified Expert Solution
Link Copied!

Question

1 Approved Answer

2. (20 pts) Dr. Dahm wants to compare some experimental data to theoretical data. Shown below is the reaction he is going to study and
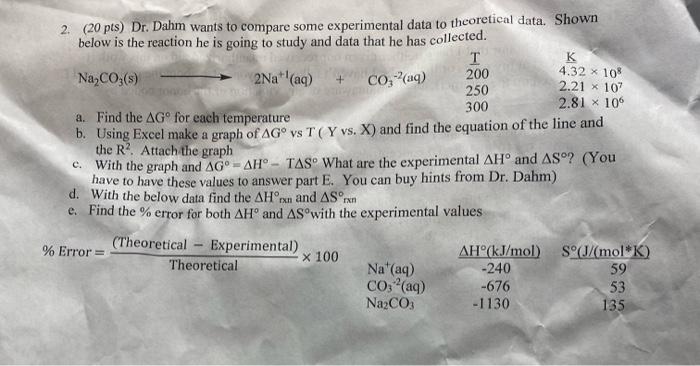
image text in transcribed
2. (20 pts) Dr. Dahm wants to compare some experimental data to theoretical data. Shown below is the reaction he is going to study and data that he has collected. b. Using Excel make a graph of G vs T ( Y vs. X ) and find the equation of the line and the R2. Attach the graph c. With the graph and G=HTS What are the experimental H and S ? (You have to have these values to answer part E. You can buy hints from Dr. Dahm) d. With the below data find the Hran and Srmn e. Find the % error for both H and S with the experimental values % Error =Theoretical(TheoreticalExperimental)100

Step by Step Solution

There are 3 Steps involved in it

Step: 1

blur-text-image

Get Instant Access to Expert-Tailored Solutions

See step-by-step solutions with expert insights and AI powered tools for academic success

Step: 2

blur-text-image

Step: 3

blur-text-image

Ace Your Homework with AI

Get the answers you need in no time with our AI-driven, step-by-step assistance

Get Started

Recommended Textbook for

Organic Chemistry

Authors: Francis Carey, Robert Giuliano

9th Edition

0073402745, 9780073402741

More Books

Students also viewed these Chemistry questions