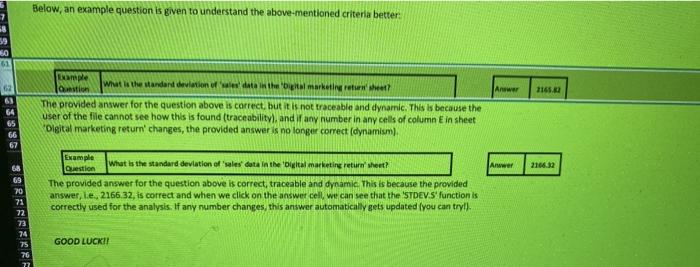
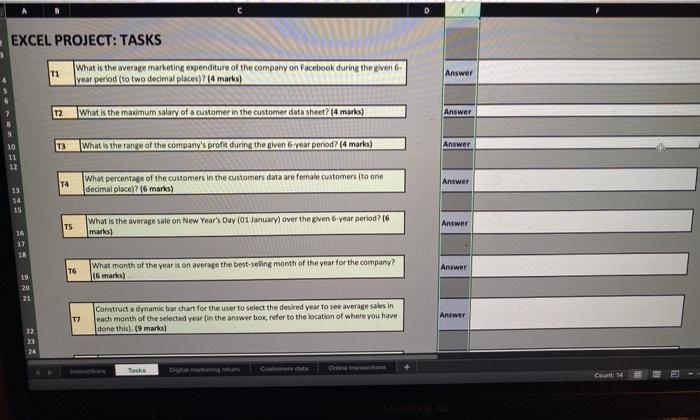
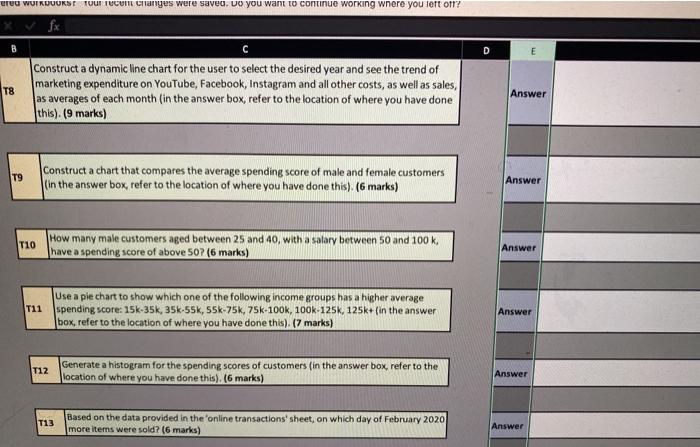
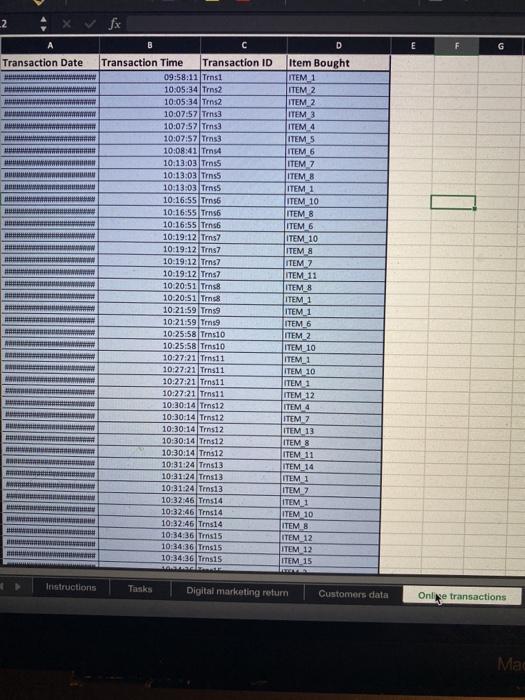
2 3 15 36 17 18 19 20 21 22 23 24 25 26 27 28 29 30 31 32 33 34 35 36 EXCEL PROJECT: INSTRUCTIONS The Data Set The current Excel file contains data provided by a medium-sized British sportswear company in Southeast England, called SE SPORTS, with an excellent online presence. In total, the company sells 96 items online (named here ITEM_1 to ITEM_96) and their main digital marketing arm is the personalised ads they put on three main popular social media platforms, i.e., YouTube, Facebook and Instagram. They are charged variously each day for the adverts shown on these platforms based on several different factors such as the number of times ads are shown, position of the ads in the page, the influencer used for dissemination, the number of clicks the ads got, etc. The company collects data from various sources and activities to inform its marketing decision making. The current data set contains 4 sheets of data collected by the company which are described in the following. The 'Digital marketing return' sheet. This sheet contains 2,192 rows of data collected by the company for the marketing budget they spent each day from the beginning of 2015 to the end of 2020 on YouTube, Facebook and Instagram, as well as all other costs they had to incur, and the total sale they made on the given day. The combination of the shown costs, i.e., cost of advertising in YouTube, Facebook and Instagram, and the 'all other costs' category constitutes the total cost of the company each day, and thus anything out of that is the company's profit. The 'Customers datasheet. This sheet contains data on the gender, annual income and the spending score attributed to 200 randomly selected customers of the company. The spending score attribute is a score that the marketing team has assigned to each of these customers based on several factors such as the frequency that a customer visits the company's website and makes a purchase, and the amount of money they spend each time. The 'Online transactions' sheet. This sheet contains 21,293 rows of online purchasing transaction data collected from 30 October 2019 to 08 April 2020. Each row shows the date of the transaction, its time and ID and the item which was bought. Note that a customer can shop online and buy, for example, three items together, but in the given data set these will be shown in three rows (although with the same transaction date, time and ID). An example of this is "Trns3 'in the given sheet. Your tasks You are asked you to carry out some data analysis tasks to provide initial insights from the data. These tasks are given in the Tasks" sheet where you are asked to carry out a set of appropriate analyses on different data sheets provided for 14 different tasks. Your work will be evaluated based on three main criteria: 0) Correctness, (W) Dynamism and traceability, and () design and professionalism. In the following each one of these criteria is explained and an illustrative examples is also shown. Correctness. If the ultimate answer provided for a given question is correct (regardless of how it is found/calculated), full correctness mark will be awarded. Dynamism and traceability. Your analysis should be traceable and understandable to the user of the file, and you are not granted any marks for this criterion If you just put the final right answer. By clicking on the answer cell the user should be able to follow how you have come up with the provided answer. Dynamism refers to the ability of your provided answer to adapt and update with any changes that might take place in the data set. Design and professionalism. You are allowed to add as many sheets as you wish to this file and work anywhere in any of the sheets. But the work of a professional analyst is easily distinguishable by neatly presented analyses and fewer sheets and calculations. Works that are very hard to follow and are all over the place tend to receive a poorer evaluation for this criterion 38 44 45 46 47 49 50 52 53 54 55 Below, an example question is given to understand the above-mentioned criteria better: 59 50 61 Example What is the standard deviation of data in the marketing retweet? Answer 2165.00 61 64 65 66 67 The provided answer for the question above is correct, but it is not traceable and dynamic. This is because the user of the file cannot see how this is found (traceability, and if any number in any cells of column in sheet Digital marketing return' changes, the provided answer is no longer correct (dynamism). Anwwer 2166.32 68 69 Example What is the standard deviation of sales' data in the Olgital marketing return sheet? Question The provided answer for the question above is correct, traceable and dynamic. This is because the provided answer, ie, 2166.32, is correct and when we click on the answer cell, we can see that the 'STDEV.S function is correctly used for the analysis. If any number changes, this answer automatically gets updated you can tryl). 70 21 72 73 74 75 GOOD LUCK! 76 77 D EXCEL PROJECT: TASKS What is the average marketing expenditure of the company on Facebook during the phen year perlod (to two decimal places)? (8 marks) Ti Answer What is the maximum salary of a customer in the customer data sheet? (4 marks) Answer T3 What is the range of the company's profil during the given 6 year period? (4 marks) Answer 11 12 T4 What percentage of the customers in the customers data are female customers (to one decimal place? (6 marks) Answer 13 15 TS What is the average sale on New Year's Day (01 January) over the given 6-year period? (6 marks) Answer 16 22 10 What month of the year is on average the best-selline month of the year for the company? 16 marks) Answer 19 20 21 Answer T7 Construct a dynamic barchart for the user to select the desired year to see average sales in each month of the selected year in the answer box, refer to the location of where you have done this). (9 marks) 22 23 Inne Tuske Online transaction Dore Count 14 ered WIKIJUUKST TOUTUU Changes were saved. Do you want to continue working where you left off? D E T8 Construct a dynamic line chart for the user to select the desired year and see the trend of marketing expenditure on YouTube, Facebook, Instagram and all other costs, as well as sales, as averages of each month (in the answer box, refer to the location of where you have done this). (9 marks) Answer T9 Construct a chart that compares the average spending score of male and female customers (in the answer box, refer to the location of where you have done this). (6 marks) Answer T10 How many male customers aged between 25 and 40, with Salary between 50 and 100 k, have a spending score of above 507(6 marks) Answer Use a pie chart to show which one of the following income groups has a higher average T11 spending score: 15k-35k, 35k-55k, 55k-75k, 75k-100k, 100k-125, 125k+ (in the answer box, refer to the location of where you have done this) (7 marks) Answer T12 Generate a histogram for the spending scores of customers (in the answer box, refer to the location of where you have done this). (6 marks) Answer T13 Based on the data provided in the online transactions' sheet, on which day of February 2020 more items were sold? (6 marks) Answer Home Insert Draw Page Layout Formulas Data Review View Tell me Calibri (Bodyli w 11 - A A == Wrap Text General Insert Delete Format Paste Merge & Centre % Conditional Format Cel Formatting a Table Styles Open recovered workbooks? Your recent changes were saved. Do you want to continue working where you left of El 41 42 T14 Generate a bar chart of the first stop seling Rems based on the online transactions data in the answer box refer to the location of where you have done this). (6 marks) Answer 43 NOTE Overall design, professionalism and good spreadsheet practice (15 marks) 53 54 55 S 57 53 56 61 2 63 GA 65 66 67 70 71 Oil marketing Obat Cound 10 Calibel (Body! 11 A A == ab Wrap Text General Paste BIU $ A Merge & Centre 6 % 2 Conditional Format Cel Formatting as Table Styles S2023 582.19 Data Variable daily marketing cost in Variable daily marketing cost Variable daily marketing YouTube in Facebook cost in Instagram All other variable costs Online Sales 01/01/2015 09.01172 0898.61 ES9264 CIOR 77 5,71 58 3 02/01/2015 1,125.14 276.19 661555 4 01/01/2015 639721 CS 145.60 E10130 716.82 E51452 ES 18:35 165.4523 5 04/01/2015 01.245.84 1929 1693.46 1481.40 67.7932 6 05/01/2015 E932.95 COG 5. 16, 21307 7 06/01 2015 1012.22 1677411 (443 615:44 6,375.76 8 07/01/2015 074259 1998.12 579.10 ES24.73 10.64.63 90/01/2015 1691195 E542 ES7243 127.01 65738 10 W01/2015 E1,632.02 11,151.77 6770.02 LES15.10 65.255 11 10/01/2015 E1.02735 E722 26 07 6410.23 62,919.92 12 31/01/2015 1783.99 E09 59.96 C738.26 TES. 13 12/01/2015 17.49 17459.69 567.84 2.5.38 14 13/01/2015 22.08 E82682 2489.09 ESS 162.11 15 LA 2015 1,272.00 8999 E60 164574 649 22 16 15/01.2015 101 144 E941.31 100 1570.40 16,635.42 17 16/01/2015 17773 1659827 508.07 ES 22.651.80 12052015 16792.21 76.75 263902 19.74 6845 19 16/01/2018 1,57872 41.044.09 36 23 1483.73 7.444 201501/2015 01.02.14 4R7:10 515 97 C30 EINESS 21 2015 ELLE 269.23 ESAB 1496.02 17 22 21/01/2015 2104 156) 23 LES 42 CERE 10 67.93 21 27/01/2015 65.83 5.2001 23723 C.165.95 24 23.01.2015 C110141 6151 0535.45 651264 IC 1052 25 24/01 2015 115777 E90.92 CS3503 24 ES 430.95 26 25.01/2015 FERS 1892.62 TESO 15:30 7,165.26 27 26/01/2015 6671.47 11017 1945 599 30 90.75 28 27/01/2015 C107764 18 E630.06 29 26/01/2011 1053 62 30 30/09/2015 520 COM 0.00 31 ODS 107 0804.14 527.60 31:32 32 31/01/2015 6718 150231 1556 50 TO5333 E60 33 01/02/2015 24821 22 TESTOOFDS 34 03 2011 42 CS 10 25 03/03/2015 DO 38 SALO 13 450 L 14579 COMO 540,30 05/02/2015 LEPE 2006/02/2018 035123 66.4043 1621 1368 39 07.02.2015 074333 23 GO 58481 86800 40 03/02/2015 25 66 JE 41 JE06 41 02/2015 C2630 FESTO +2583 8909 163 GO Oota SARIS C'EST ED SO met CO TOP sit GE 5 al Customer On the tutto Tasks Digital marketing burn 11 OLIGOEL C E1.06125 1995.76 6.906.66 17,740.83 1980.66 11.0103 BE68S GZ 9683 10 1.233.44 21 164.79 11.05.08 01.04.09 1436.71 11,08102 1321.75 112530 111819 1.100.21 94305 1,304.37 1,181.96 61,725.44 11,11257 1,1714 (746.20 692.35 (796.30 E688.81 ESTO 15.04.20 467547 ESO029 (57433 (739.60 $37.59 CGI 255.10 IC61119 492.55 1870.52 41 09/02/2015 42 30/02/2015 43 11/02/2015 44 12/02/2015 45 13/02/2015 46 14/02/2015 47 15/02/2015 48 15/02/2015 49 17/02/2015 50 18/02/2015 51 19/02/2015 52 20/03/2015 53 21/02/2015 54 22/02/2015 55 23/03/2015 564/03/2015 57 3502015 58 26.03.2015 59 2703/2015 602.02.2015 61 01/01/2015 62 01/01/2015 DON 2015 64 2015 65 03/01/2015 66 06/03/2015 07/07 6 ON/O2OES 69 09/01/2015 20 TO03/2015 71 31/01/2015 72 2015 73 11/01/2015 74 14/01/2015 75 25.01.2015 76 01/2015 77 17/03/2015 71 23/03/2015 79 29/01/2015 80 20/01/2018 01 21/01/2015 32 32/03/2015 3 FILES 1987.10 192.72 9876) 1890.40 CR9281 949.67 104426 2858 35 20.30 (69157 078741 HSS 42.60 673697 0672.15 684343 016415 672173 01.047,77 ETIT 11 C102545 275417 JCN613 1468.03 071403 CERI 1 (46) 01 62290 CS JE64.53 749 1924.00 1812.70 1954.55 61207.10 1,12750 (8200 11 106 1 441162 2.51 21.203.11 (1,02034 CS6 56 0222 34 674425 650000 536 94 5102 06244 SER (51222 24 502:41 C69.98 603.28 507-29 149.14 1526.19 2360.69 162355 02.11 151363 2489 047431 651770 155033 6576.69 1569 25 (501 1497.08 CES 27 (5168 ES1220 TO (510.09 $11.07 6520.05 244063 415.00 1545.43 653335 TES 1636826 22338 LES.RO 0703 CHOZ, 1416.99 25.11 1029143 COBIS 9:48 1654 23,973.66 E204470 16.410.96 05.697.63 6,377.95 14.451.54 24.44703 5,102.23 165,006 59 65.210.12 17,44 418.19 05.31464 CZ 50 CR0.44 1419199 CS 1890 13,27412 266687 17.103 78605 CS 15,71352 38452 ICE 110Y 16.0210 IS TUO2 ER 02073 400) 142127 16122 1602.10 160923 1550 STES 68135 7.417 09132 093602 TRON 93 1925.03 244247 CL003 01.1998 654335 TESORER L50106 16616 1654130 1155335 69772 0507.97 IS 35347 5,61713 500.70 17.0543 0416 (41172 2355 ST 26.23251 IZ CUBO Instruction Tasks Digital marketing return Customers data Online transactions = = THE li Merge & Centre H9 fx H C D Customerid Gender Age Annual Income (k) Spending Score (1-100) 1 Male 19 15,000 39 2 Male 21 15,000 81 3 Female 20 16,000 6 4 Female 23 16,000 77 s Female 31 E17,000 40 6 Female 22 17,000 76 7 Female 35 E18,000 6 8 Female 23 E18,000 94 o 9 Male 64 E19,000 3 1 10 Female 30 19,000 72 11 Male 67 19,000 14 3 12 Female 35 19,000 99 4 13 Female 58 20,000 151 5 14 Female 24 E20,000 77 6 15 Male 37 20,000 13 7 16 Male 22 20,000 79 8 17 Female 35 21,000 35 9 18 Male 20 21,000 66 0 19 Male 52 23,000 29 1 20 Female 35 23,000 98 2 21 Male 35 24,000 35 3 22 Male 25 24,000 73 4 23 Female 46 25,000 5 5 24 Male 31 25,000 73 6 25 Female 54 28,000 14 7 26 Male 29 E28,000 82 8 27 Female 45 28,000 32 9 28 Male 35 28,000 61 0 29 Female 40 E29,000 31 30 Female 23 29.000 87 2 31 Male 60 30,000 4 13 32 Female 21 E30,000 73 14 33 Male 53 33.000 4 35 34 Male 18 E33,000 92 36 35 Female 49 33,000 14 37 36 Female 21 3,000 81 88 37 Female 42 E34,000 17 39 28 Female 30 34.000 73 90 39 Female 36 137,000 26 11 40 Female 20 37,000 75 2 41 Female 65 138,000 35 GIVE Instructions Tasks Digital marketing return Customers data Online transactions Mace 2 fx A B C D E G Transaction Date Transaction Time Transaction ID 09:58:11 Trnsi 10:05:34 Trns2 10:05:34 Trns2 10:07:57 Trns3 10:07:57 Trns 10:07:57 Trns 10:08:41 Trnst 10:13:03 Trnss 10:13:03 Trns 10:13:03 Trnss 10:16:55 Trns 10:16:55 Trns 10:16:55 Tenso 10:19:12 Trns 10:19:12 Trns7 10:19:12 Trns 10:19:12 Trns7 10:20:51 Trns 10:20:51 Trns 10 21:59 Trang 10:21:59 Trns 10:25:58 Trns10 10:25:58 Trns10 10:27:21 Trns11 10:27:21 Trnsii 10:27:21 Trns11 10:27:21 Trns11 10:30:14 Trns12 10:30:14 Trns12 10:30:14 Trns12 10:30:14 Trns12 10:30:14 Tins12 10:31:24 Trns13 10:31:24 Trns13 10:31:24Trns13 10:32:46 Tins14 10:32:46 Trns14 10:32:46 Trns14 10:34:36 Tes15 10:34:36 Trns15 10:34:36 Trns15 WORLD Item Bought ITEM 1 ITEM 2 ITEM 2 ITEM 3 ITEM 4 ITEMS ITEM 6 6 LTEM 7 ITEM 8 ITEM 1 ITEM 10 ITEM 8 ITEM 6 ITEM_10 ITEM 8 ITEM Z ITEM 11 ITEM_8 ITEM 1 ITEM 1 ITEM_6 ITEM 2 ITEM 10 ITEM_1 ITEM 10 ITEM 1 ITEM 12 ITEM 4 ITEM 7 ITEM 13 ITEMS ITEM 11 ITEM_14 ITEM 1 ITEM 7 ITEM 1 ITEM 10 ITEM 8 ITEM 12 ITEM 12 ITEM 15 Instructions Tasks Digital marketing retum Customers data Online transactions Mae 2 3 15 36 17 18 19 20 21 22 23 24 25 26 27 28 29 30 31 32 33 34 35 36 EXCEL PROJECT: INSTRUCTIONS The Data Set The current Excel file contains data provided by a medium-sized British sportswear company in Southeast England, called SE SPORTS, with an excellent online presence. In total, the company sells 96 items online (named here ITEM_1 to ITEM_96) and their main digital marketing arm is the personalised ads they put on three main popular social media platforms, i.e., YouTube, Facebook and Instagram. They are charged variously each day for the adverts shown on these platforms based on several different factors such as the number of times ads are shown, position of the ads in the page, the influencer used for dissemination, the number of clicks the ads got, etc. The company collects data from various sources and activities to inform its marketing decision making. The current data set contains 4 sheets of data collected by the company which are described in the following. The 'Digital marketing return' sheet. This sheet contains 2,192 rows of data collected by the company for the marketing budget they spent each day from the beginning of 2015 to the end of 2020 on YouTube, Facebook and Instagram, as well as all other costs they had to incur, and the total sale they made on the given day. The combination of the shown costs, i.e., cost of advertising in YouTube, Facebook and Instagram, and the 'all other costs' category constitutes the total cost of the company each day, and thus anything out of that is the company's profit. The 'Customers datasheet. This sheet contains data on the gender, annual income and the spending score attributed to 200 randomly selected customers of the company. The spending score attribute is a score that the marketing team has assigned to each of these customers based on several factors such as the frequency that a customer visits the company's website and makes a purchase, and the amount of money they spend each time. The 'Online transactions' sheet. This sheet contains 21,293 rows of online purchasing transaction data collected from 30 October 2019 to 08 April 2020. Each row shows the date of the transaction, its time and ID and the item which was bought. Note that a customer can shop online and buy, for example, three items together, but in the given data set these will be shown in three rows (although with the same transaction date, time and ID). An example of this is "Trns3 'in the given sheet. Your tasks You are asked you to carry out some data analysis tasks to provide initial insights from the data. These tasks are given in the Tasks" sheet where you are asked to carry out a set of appropriate analyses on different data sheets provided for 14 different tasks. Your work will be evaluated based on three main criteria: 0) Correctness, (W) Dynamism and traceability, and () design and professionalism. In the following each one of these criteria is explained and an illustrative examples is also shown. Correctness. If the ultimate answer provided for a given question is correct (regardless of how it is found/calculated), full correctness mark will be awarded. Dynamism and traceability. Your analysis should be traceable and understandable to the user of the file, and you are not granted any marks for this criterion If you just put the final right answer. By clicking on the answer cell the user should be able to follow how you have come up with the provided answer. Dynamism refers to the ability of your provided answer to adapt and update with any changes that might take place in the data set. Design and professionalism. You are allowed to add as many sheets as you wish to this file and work anywhere in any of the sheets. But the work of a professional analyst is easily distinguishable by neatly presented analyses and fewer sheets and calculations. Works that are very hard to follow and are all over the place tend to receive a poorer evaluation for this criterion 38 44 45 46 47 49 50 52 53 54 55 Below, an example question is given to understand the above-mentioned criteria better: 59 50 61 Example What is the standard deviation of data in the marketing retweet? Answer 2165.00 61 64 65 66 67 The provided answer for the question above is correct, but it is not traceable and dynamic. This is because the user of the file cannot see how this is found (traceability, and if any number in any cells of column in sheet Digital marketing return' changes, the provided answer is no longer correct (dynamism). Anwwer 2166.32 68 69 Example What is the standard deviation of sales' data in the Olgital marketing return sheet? Question The provided answer for the question above is correct, traceable and dynamic. This is because the provided answer, ie, 2166.32, is correct and when we click on the answer cell, we can see that the 'STDEV.S function is correctly used for the analysis. If any number changes, this answer automatically gets updated you can tryl). 70 21 72 73 74 75 GOOD LUCK! 76 77 D EXCEL PROJECT: TASKS What is the average marketing expenditure of the company on Facebook during the phen year perlod (to two decimal places)? (8 marks) Ti Answer What is the maximum salary of a customer in the customer data sheet? (4 marks) Answer T3 What is the range of the company's profil during the given 6 year period? (4 marks) Answer 11 12 T4 What percentage of the customers in the customers data are female customers (to one decimal place? (6 marks) Answer 13 15 TS What is the average sale on New Year's Day (01 January) over the given 6-year period? (6 marks) Answer 16 22 10 What month of the year is on average the best-selline month of the year for the company? 16 marks) Answer 19 20 21 Answer T7 Construct a dynamic barchart for the user to select the desired year to see average sales in each month of the selected year in the answer box, refer to the location of where you have done this). (9 marks) 22 23 Inne Tuske Online transaction Dore Count 14 ered WIKIJUUKST TOUTUU Changes were saved. Do you want to continue working where you left off? D E T8 Construct a dynamic line chart for the user to select the desired year and see the trend of marketing expenditure on YouTube, Facebook, Instagram and all other costs, as well as sales, as averages of each month (in the answer box, refer to the location of where you have done this). (9 marks) Answer T9 Construct a chart that compares the average spending score of male and female customers (in the answer box, refer to the location of where you have done this). (6 marks) Answer T10 How many male customers aged between 25 and 40, with Salary between 50 and 100 k, have a spending score of above 507(6 marks) Answer Use a pie chart to show which one of the following income groups has a higher average T11 spending score: 15k-35k, 35k-55k, 55k-75k, 75k-100k, 100k-125, 125k+ (in the answer box, refer to the location of where you have done this) (7 marks) Answer T12 Generate a histogram for the spending scores of customers (in the answer box, refer to the location of where you have done this). (6 marks) Answer T13 Based on the data provided in the online transactions' sheet, on which day of February 2020 more items were sold? (6 marks) Answer Home Insert Draw Page Layout Formulas Data Review View Tell me Calibri (Bodyli w 11 - A A == Wrap Text General Insert Delete Format Paste Merge & Centre % Conditional Format Cel Formatting a Table Styles Open recovered workbooks? Your recent changes were saved. Do you want to continue working where you left of El 41 42 T14 Generate a bar chart of the first stop seling Rems based on the online transactions data in the answer box refer to the location of where you have done this). (6 marks) Answer 43 NOTE Overall design, professionalism and good spreadsheet practice (15 marks) 53 54 55 S 57 53 56 61 2 63 GA 65 66 67 70 71 Oil marketing Obat Cound 10 Calibel (Body! 11 A A == ab Wrap Text General Paste BIU $ A Merge & Centre 6 % 2 Conditional Format Cel Formatting as Table Styles S2023 582.19 Data Variable daily marketing cost in Variable daily marketing cost Variable daily marketing YouTube in Facebook cost in Instagram All other variable costs Online Sales 01/01/2015 09.01172 0898.61 ES9264 CIOR 77 5,71 58 3 02/01/2015 1,125.14 276.19 661555 4 01/01/2015 639721 CS 145.60 E10130 716.82 E51452 ES 18:35 165.4523 5 04/01/2015 01.245.84 1929 1693.46 1481.40 67.7932 6 05/01/2015 E932.95 COG 5. 16, 21307 7 06/01 2015 1012.22 1677411 (443 615:44 6,375.76 8 07/01/2015 074259 1998.12 579.10 ES24.73 10.64.63 90/01/2015 1691195 E542 ES7243 127.01 65738 10 W01/2015 E1,632.02 11,151.77 6770.02 LES15.10 65.255 11 10/01/2015 E1.02735 E722 26 07 6410.23 62,919.92 12 31/01/2015 1783.99 E09 59.96 C738.26 TES. 13 12/01/2015 17.49 17459.69 567.84 2.5.38 14 13/01/2015 22.08 E82682 2489.09 ESS 162.11 15 LA 2015 1,272.00 8999 E60 164574 649 22 16 15/01.2015 101 144 E941.31 100 1570.40 16,635.42 17 16/01/2015 17773 1659827 508.07 ES 22.651.80 12052015 16792.21 76.75 263902 19.74 6845 19 16/01/2018 1,57872 41.044.09 36 23 1483.73 7.444 201501/2015 01.02.14 4R7:10 515 97 C30 EINESS 21 2015 ELLE 269.23 ESAB 1496.02 17 22 21/01/2015 2104 156) 23 LES 42 CERE 10 67.93 21 27/01/2015 65.83 5.2001 23723 C.165.95 24 23.01.2015 C110141 6151 0535.45 651264 IC 1052 25 24/01 2015 115777 E90.92 CS3503 24 ES 430.95 26 25.01/2015 FERS 1892.62 TESO 15:30 7,165.26 27 26/01/2015 6671.47 11017 1945 599 30 90.75 28 27/01/2015 C107764 18 E630.06 29 26/01/2011 1053 62 30 30/09/2015 520 COM 0.00 31 ODS 107 0804.14 527.60 31:32 32 31/01/2015 6718 150231 1556 50 TO5333 E60 33 01/02/2015 24821 22 TESTOOFDS 34 03 2011 42 CS 10 25 03/03/2015 DO 38 SALO 13 450 L 14579 COMO 540,30 05/02/2015 LEPE 2006/02/2018 035123 66.4043 1621 1368 39 07.02.2015 074333 23 GO 58481 86800 40 03/02/2015 25 66 JE 41 JE06 41 02/2015 C2630 FESTO +2583 8909 163 GO Oota SARIS C'EST ED SO met CO TOP sit GE 5 al Customer On the tutto Tasks Digital marketing burn 11 OLIGOEL C E1.06125 1995.76 6.906.66 17,740.83 1980.66 11.0103 BE68S GZ 9683 10 1.233.44 21 164.79 11.05.08 01.04.09 1436.71 11,08102 1321.75 112530 111819 1.100.21 94305 1,304.37 1,181.96 61,725.44 11,11257 1,1714 (746.20 692.35 (796.30 E688.81 ESTO 15.04.20 467547 ESO029 (57433 (739.60 $37.59 CGI 255.10 IC61119 492.55 1870.52 41 09/02/2015 42 30/02/2015 43 11/02/2015 44 12/02/2015 45 13/02/2015 46 14/02/2015 47 15/02/2015 48 15/02/2015 49 17/02/2015 50 18/02/2015 51 19/02/2015 52 20/03/2015 53 21/02/2015 54 22/02/2015 55 23/03/2015 564/03/2015 57 3502015 58 26.03.2015 59 2703/2015 602.02.2015 61 01/01/2015 62 01/01/2015 DON 2015 64 2015 65 03/01/2015 66 06/03/2015 07/07 6 ON/O2OES 69 09/01/2015 20 TO03/2015 71 31/01/2015 72 2015 73 11/01/2015 74 14/01/2015 75 25.01.2015 76 01/2015 77 17/03/2015 71 23/03/2015 79 29/01/2015 80 20/01/2018 01 21/01/2015 32 32/03/2015 3 FILES 1987.10 192.72 9876) 1890.40 CR9281 949.67 104426 2858 35 20.30 (69157 078741 HSS 42.60 673697 0672.15 684343 016415 672173 01.047,77 ETIT 11 C102545 275417 JCN613 1468.03 071403 CERI 1 (46) 01 62290 CS JE64.53 749 1924.00 1812.70 1954.55 61207.10 1,12750 (8200 11 106 1 441162 2.51 21.203.11 (1,02034 CS6 56 0222 34 674425 650000 536 94 5102 06244 SER (51222 24 502:41 C69.98 603.28 507-29 149.14 1526.19 2360.69 162355 02.11 151363 2489 047431 651770 155033 6576.69 1569 25 (501 1497.08 CES 27 (5168 ES1220 TO (510.09 $11.07 6520.05 244063 415.00 1545.43 653335 TES 1636826 22338 LES.RO 0703 CHOZ, 1416.99 25.11 1029143 COBIS 9:48 1654 23,973.66 E204470 16.410.96 05.697.63 6,377.95 14.451.54 24.44703 5,102.23 165,006 59 65.210.12 17,44 418.19 05.31464 CZ 50 CR0.44 1419199 CS 1890 13,27412 266687 17.103 78605 CS 15,71352 38452 ICE 110Y 16.0210 IS TUO2 ER 02073 400) 142127 16122 1602.10 160923 1550 STES 68135 7.417 09132 093602 TRON 93 1925.03 244247 CL003 01.1998 654335 TESORER L50106 16616 1654130 1155335 69772 0507.97 IS 35347 5,61713 500.70 17.0543 0416 (41172 2355 ST 26.23251 IZ CUBO Instruction Tasks Digital marketing return Customers data Online transactions = = THE li Merge & Centre H9 fx H C D Customerid Gender Age Annual Income (k) Spending Score (1-100) 1 Male 19 15,000 39 2 Male 21 15,000 81 3 Female 20 16,000 6 4 Female 23 16,000 77 s Female 31 E17,000 40 6 Female 22 17,000 76 7 Female 35 E18,000 6 8 Female 23 E18,000 94 o 9 Male 64 E19,000 3 1 10 Female 30 19,000 72 11 Male 67 19,000 14 3 12 Female 35 19,000 99 4 13 Female 58 20,000 151 5 14 Female 24 E20,000 77 6 15 Male 37 20,000 13 7 16 Male 22 20,000 79 8 17 Female 35 21,000 35 9 18 Male 20 21,000 66 0 19 Male 52 23,000 29 1 20 Female 35 23,000 98 2 21 Male 35 24,000 35 3 22 Male 25 24,000 73 4 23 Female 46 25,000 5 5 24 Male 31 25,000 73 6 25 Female 54 28,000 14 7 26 Male 29 E28,000 82 8 27 Female 45 28,000 32 9 28 Male 35 28,000 61 0 29 Female 40 E29,000 31 30 Female 23 29.000 87 2 31 Male 60 30,000 4 13 32 Female 21 E30,000 73 14 33 Male 53 33.000 4 35 34 Male 18 E33,000 92 36 35 Female 49 33,000 14 37 36 Female 21 3,000 81 88 37 Female 42 E34,000 17 39 28 Female 30 34.000 73 90 39 Female 36 137,000 26 11 40 Female 20 37,000 75 2 41 Female 65 138,000 35 GIVE Instructions Tasks Digital marketing return Customers data Online transactions Mace 2 fx A B C D E G Transaction Date Transaction Time Transaction ID 09:58:11 Trnsi 10:05:34 Trns2 10:05:34 Trns2 10:07:57 Trns3 10:07:57 Trns 10:07:57 Trns 10:08:41 Trnst 10:13:03 Trnss 10:13:03 Trns 10:13:03 Trnss 10:16:55 Trns 10:16:55 Trns 10:16:55 Tenso 10:19:12 Trns 10:19:12 Trns7 10:19:12 Trns 10:19:12 Trns7 10:20:51 Trns 10:20:51 Trns 10 21:59 Trang 10:21:59 Trns 10:25:58 Trns10 10:25:58 Trns10 10:27:21 Trns11 10:27:21 Trnsii 10:27:21 Trns11 10:27:21 Trns11 10:30:14 Trns12 10:30:14 Trns12 10:30:14 Trns12 10:30:14 Trns12 10:30:14 Tins12 10:31:24 Trns13 10:31:24 Trns13 10:31:24Trns13 10:32:46 Tins14 10:32:46 Trns14 10:32:46 Trns14 10:34:36 Tes15 10:34:36 Trns15 10:34:36 Trns15 WORLD Item Bought ITEM 1 ITEM 2 ITEM 2 ITEM 3 ITEM 4 ITEMS ITEM 6 6 LTEM 7 ITEM 8 ITEM 1 ITEM 10 ITEM 8 ITEM 6 ITEM_10 ITEM 8 ITEM Z ITEM 11 ITEM_8 ITEM 1 ITEM 1 ITEM_6 ITEM 2 ITEM 10 ITEM_1 ITEM 10 ITEM 1 ITEM 12 ITEM 4 ITEM 7 ITEM 13 ITEMS ITEM 11 ITEM_14 ITEM 1 ITEM 7 ITEM 1 ITEM 10 ITEM 8 ITEM 12 ITEM 12 ITEM 15 Instructions Tasks Digital marketing retum Customers data Online transactions Mae