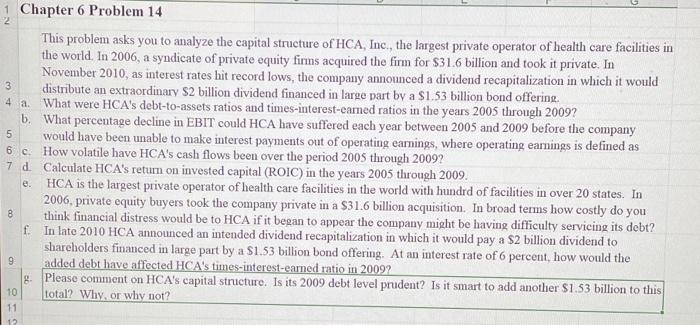
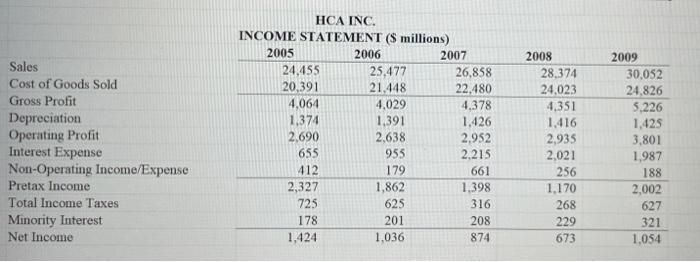
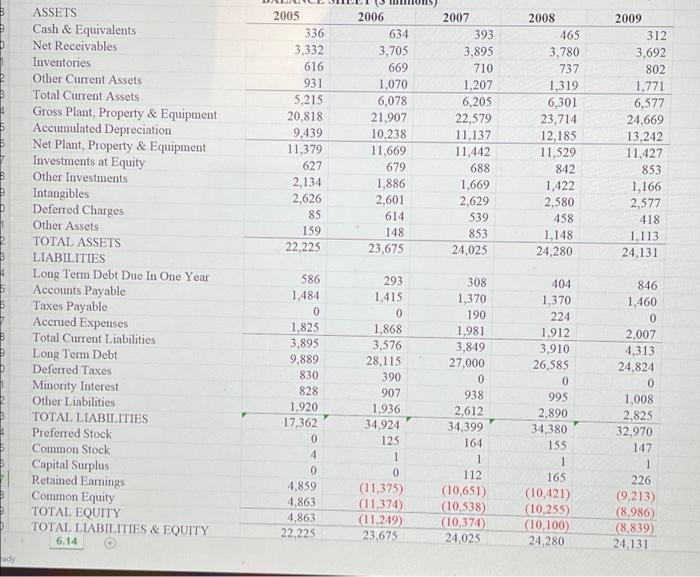
2 3 4 a 5 1 Chapter 6 Problem 14 This problem asks you to analyze the capital structure of HCA, Inc., the largest private operator of health care facilities in the world. In 2006, a syndicate of private equity firms acquired the firm for $3L6 billion and took it private. In November 2010, as interest rates hit record lows, the company announced a dividend recapitalization in which it would distribute an extraordinary $2 billion dividend financed in large part by a $1.53 billion bond offering What were HCA's debt-to-assets ratios and times-interest-camed ratios in the years 2005 through 2009? b. What percentage decline in EBIT could HCA have suffered each year between 2005 and 2009 before the company would have been unable to make interest payments out of operating earnings, where operating earnings is defined as 6.c. How volatile have HCA's cash flows been over the period 2005 through 2009? 7 d. Calculate HCA's retum on invested capital (ROIC) in the years 2005 through 2009. HCA is the largest private operator of health care facilities in the world with hundrd of facilities in over 20 states. In 2006, private equity buyers took the company private in a $31.6 billion acquisition. In broad terms how costly do you think financial distress would be to HCA if it began to appear the company might be having difficulty servicing its debt? In late 2010 HCA announced an intended dividend recapitalization in which it would pay a $2 billion dividend to shareholders financed in large part by a $1.53 billion bond offering. At an interest rate of 6 percent, how would the added debt have affected HCA's times-interest-eared ratio in 2009 8. Please comment on HCA's capital structure. Is its 2009 debt level prudent? Is it smart to add another $1.53 billion to this total? Why, or why not? e. 8 f 9 10 11 12 Sales Cost of Goods Sold Gross Profit Depreciation Operating Profit Interest Expense Non-Operating Income/Expense Pretax Income Total Income Taxes Minority Interest Net Income HCA INC. INCOME STATEMENT ($ millions) 2005 2006 2007 24.455 25.477 26,858 20,391 21.448 22.480 4,064 4,029 4,378 1,374 1,391 1,426 2,690 2,638 2,952 655 955 2.215 412 179 661 2,327 1,862 1.398 725 625 316 178 201 208 1,424 1,036 874 2008 28,374 24,023 4.351 1.416 2,935 2,021 256 1.170 268 229 673 2009 30.052 24,826 5.226 1.425 3,801 1.987 188 2,002 627 321 1,054 2005 336 3,332 616 931 5,215 20,818 9.439 11,379 627 2,134 2,626 85 159 22,225 2006 634 3,705 669 1,070 6,078 21,907 10,238 11,669 679 1,886 2,601 614 148 23.675 2007 393 3,895 710 1,207 6,205 22,579 11,137 11.442 688 1,669 2.629 539 853 24,025 2008 465 3,780 737 1,319 6,301 23,714 12.185 11.529 842 1,422 2,580 458 1,148 24,280 2009 312 3,692 802 1,771 6,577 24,669 13,242 11,427 853 1,166 2,577 418 1,113 24.131 ASSETS Cash & Equivalents Net Receivables Inventories Other Current Assets Total Current Assets Gross Plant, Property & Equipment Accumulated Depreciation Net Plant, Property & Equipment Investments at Equity Other Investments Intangibles Deferred Charges Other Assets TOTAL ASSETS LIABILITIES Long Term Debt Due In One Year Accounts Payable Taxes Payable Accrued Expenses Total Current Liabilities Long Term Debt Deferred Taxes Minority Interest Other Liabilities TOTAL LIABILITIES Preferred Stock Common Stock Capital Surplus Retained Earnings Common Equity TOTAL EQUITY TOTAL LIABILITIES & EQUITY 6.14 586 1,484 0 1,825 3,895 9,889 830 828 1,920 17,362 0 4 0 4,859 4,863 4,863 22.225 293 1.415 0 1.868 3,576 28,115 390 907 1,936 34.924 125 1 0 (11,375) (11,374) (11.249) 23.675 308 1,370 190 1.981 3,849 27,000 0 938 2,612 34.399 164 1 112 (10,651) (10.538) (10,374) 24,025 404 1,370 224 1.912 3,910 26,585 0 995 2.890 34,380 155 1 165 (10,421) (10,255) (10.100) 24,280 846 1,460 0 2.007 4,313 24.824 0 1,008 2.825 32,970 147 1 226 (9.213) (8,986) (8,839) 24.131 ady 2 3 4 a 5 1 Chapter 6 Problem 14 This problem asks you to analyze the capital structure of HCA, Inc., the largest private operator of health care facilities in the world. In 2006, a syndicate of private equity firms acquired the firm for $3L6 billion and took it private. In November 2010, as interest rates hit record lows, the company announced a dividend recapitalization in which it would distribute an extraordinary $2 billion dividend financed in large part by a $1.53 billion bond offering What were HCA's debt-to-assets ratios and times-interest-camed ratios in the years 2005 through 2009? b. What percentage decline in EBIT could HCA have suffered each year between 2005 and 2009 before the company would have been unable to make interest payments out of operating earnings, where operating earnings is defined as 6.c. How volatile have HCA's cash flows been over the period 2005 through 2009? 7 d. Calculate HCA's retum on invested capital (ROIC) in the years 2005 through 2009. HCA is the largest private operator of health care facilities in the world with hundrd of facilities in over 20 states. In 2006, private equity buyers took the company private in a $31.6 billion acquisition. In broad terms how costly do you think financial distress would be to HCA if it began to appear the company might be having difficulty servicing its debt? In late 2010 HCA announced an intended dividend recapitalization in which it would pay a $2 billion dividend to shareholders financed in large part by a $1.53 billion bond offering. At an interest rate of 6 percent, how would the added debt have affected HCA's times-interest-eared ratio in 2009 8. Please comment on HCA's capital structure. Is its 2009 debt level prudent? Is it smart to add another $1.53 billion to this total? Why, or why not? e. 8 f 9 10 11 12 Sales Cost of Goods Sold Gross Profit Depreciation Operating Profit Interest Expense Non-Operating Income/Expense Pretax Income Total Income Taxes Minority Interest Net Income HCA INC. INCOME STATEMENT ($ millions) 2005 2006 2007 24.455 25.477 26,858 20,391 21.448 22.480 4,064 4,029 4,378 1,374 1,391 1,426 2,690 2,638 2,952 655 955 2.215 412 179 661 2,327 1,862 1.398 725 625 316 178 201 208 1,424 1,036 874 2008 28,374 24,023 4.351 1.416 2,935 2,021 256 1.170 268 229 673 2009 30.052 24,826 5.226 1.425 3,801 1.987 188 2,002 627 321 1,054 2005 336 3,332 616 931 5,215 20,818 9.439 11,379 627 2,134 2,626 85 159 22,225 2006 634 3,705 669 1,070 6,078 21,907 10,238 11,669 679 1,886 2,601 614 148 23.675 2007 393 3,895 710 1,207 6,205 22,579 11,137 11.442 688 1,669 2.629 539 853 24,025 2008 465 3,780 737 1,319 6,301 23,714 12.185 11.529 842 1,422 2,580 458 1,148 24,280 2009 312 3,692 802 1,771 6,577 24,669 13,242 11,427 853 1,166 2,577 418 1,113 24.131 ASSETS Cash & Equivalents Net Receivables Inventories Other Current Assets Total Current Assets Gross Plant, Property & Equipment Accumulated Depreciation Net Plant, Property & Equipment Investments at Equity Other Investments Intangibles Deferred Charges Other Assets TOTAL ASSETS LIABILITIES Long Term Debt Due In One Year Accounts Payable Taxes Payable Accrued Expenses Total Current Liabilities Long Term Debt Deferred Taxes Minority Interest Other Liabilities TOTAL LIABILITIES Preferred Stock Common Stock Capital Surplus Retained Earnings Common Equity TOTAL EQUITY TOTAL LIABILITIES & EQUITY 6.14 586 1,484 0 1,825 3,895 9,889 830 828 1,920 17,362 0 4 0 4,859 4,863 4,863 22.225 293 1.415 0 1.868 3,576 28,115 390 907 1,936 34.924 125 1 0 (11,375) (11,374) (11.249) 23.675 308 1,370 190 1.981 3,849 27,000 0 938 2,612 34.399 164 1 112 (10,651) (10.538) (10,374) 24,025 404 1,370 224 1.912 3,910 26,585 0 995 2.890 34,380 155 1 165 (10,421) (10,255) (10.100) 24,280 846 1,460 0 2.007 4,313 24.824 0 1,008 2.825 32,970 147 1 226 (9.213) (8,986) (8,839) 24.131 ady