

Answered step by step
Verified Expert Solution
Question
1 Approved Answer
2 & 3 please 2. The following table summarizes risk premiums for stocks in the United States, relative to treasury bills and bonds, for different
2 & 3 please 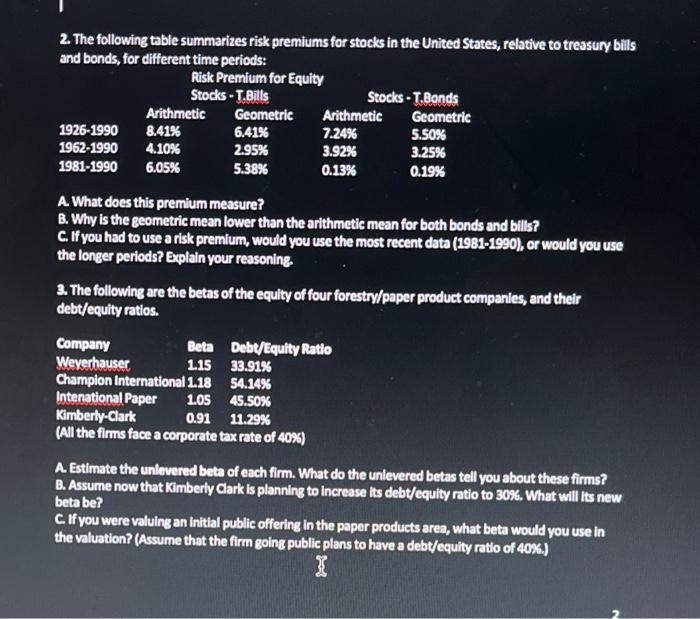
2. The following table summarizes risk premiums for stocks in the United States, relative to treasury bills and bonds, for different time periods: Risk Premium for Equity Stocks - T.Bills Stocks - T.Bonds Arithmetic Geometric Arithmetic Geometric 1926-1990 8.41% 6.41% 7.24% 5.50% 1962-1990 4.10% 2.95% 3.92% 3.25% 1981-1990 6.05% 5.38% 0.13% 0.19% A. What does this premium measure? B. Why Is the geometric mean lower than the arithmetic mean for both bonds and bills? C. If you had to use a risk premium, would you use the most recent data (1981-1990), or would you use the longer periods? Explain your reasoning. 3. The following are the betas of the equity of four forestry/paper product companies, and their debt/equity ratlos. Company Beta Debt/Equity Ratio Weyerhauser 1.15 33.91% Champion International 118 54.14% Intenational Paper 1.OS 45.50% Kimberly-Clark 0.91 11.29% (All the firms face a corporate tax rate of 40%) A Estimate the unlevered beta of each firm. What do the unlevered betas tell you about these firms? B. Assume now that Kimberly Clark is planning to increase its debt/equity ratio to 30%. What will its new beta be? C. If you were valuing an initial public offering in the paper products area, what beta would you use in the valuation? (Assume that the firm going public plans to have a debt/equity ratio of 40%.) Step by Step Solution
There are 3 Steps involved in it
Step: 1

Get Instant Access to Expert-Tailored Solutions
See step-by-step solutions with expert insights and AI powered tools for academic success
Step: 2

Step: 3
Ace Your Homework with AI
Get the answers you need in no time with our AI-driven, step-by-step assistance
Get Started
Financial and Managerial Accounting
Authors: Jonathan E. Duchac, James M. Reeve, Carl S. Warren
11th Edition
9780538480901, 9781111525774, 538480890, 538480904, 1111525773, 978-0538480895