Answered step by step
Verified Expert Solution
Question
1 Approved Answer
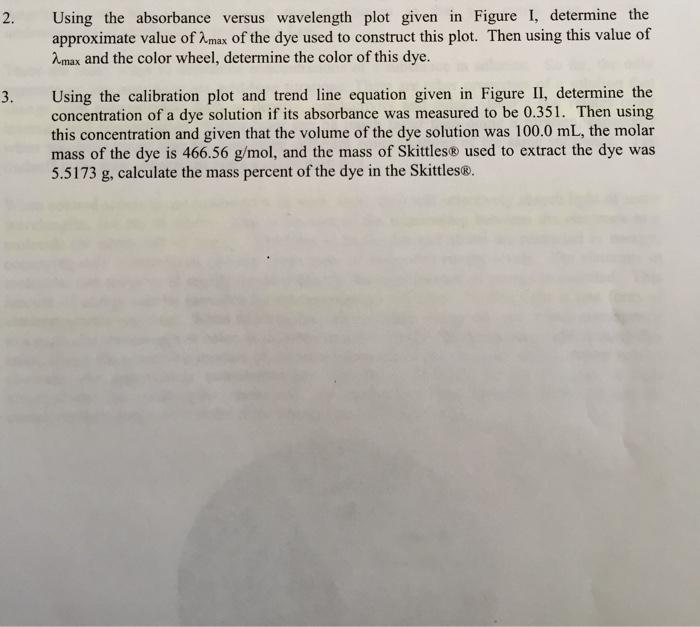
2. 3. Using the absorbance versus wavelength plot given in Figure I, determine the approximate value of Amax of the dye used to construct


2. 3. Using the absorbance versus wavelength plot given in Figure I, determine the approximate value of Amax of the dye used to construct this plot. Then using this value of Amax and the color wheel, determine the color of this dye. Using the calibration plot and trend line equation given in Figure II, determine the concentration of a dye solution if its absorbance was measured to be 0.351. Then using this concentration and given that the volume of the dye solution was 100.0 mL, the molar mass of the dye is 466.56 g/mol, and the mass of Skittles used to extract the dye was 5.5173 g, calculate the mass percent of the dye in the Skittles. Figure 1: Figure II: Absorbance versus wavelength plot of a food dye to determine max. Absorbance 900 Stertaale 0.700 0.300 0.300 4,000 !! SHEM 556 Wavelength) Absorbance versus concentration plot of the same food dye in Figure I. The line goes through 0,0. The slope is & and R gives the fit (will be 1 if the fit is exact). Calibration Curve of Food Dye at 572 CHEM 400 THE 3-(9,80 x 10's -0.994 (M 630 700
Step by Step Solution
★★★★★
3.46 Rating (166 Votes )
There are 3 Steps involved in it
Step: 1
SOLUTION 2 3 3 Mass Mass of solute total mass 100 concentra...
Get Instant Access to Expert-Tailored Solutions
See step-by-step solutions with expert insights and AI powered tools for academic success
Step: 2

Step: 3

Ace Your Homework with AI
Get the answers you need in no time with our AI-driven, step-by-step assistance
Get Started


