Answered step by step
Verified Expert Solution
Question
1 Approved Answer
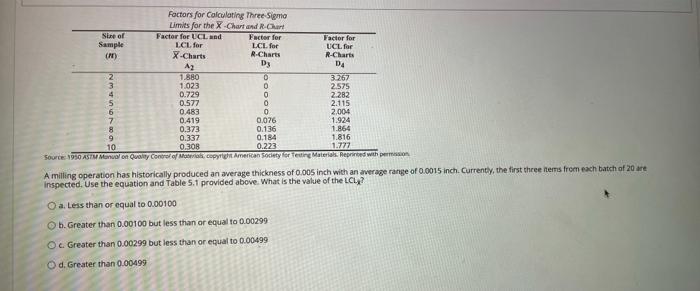
2 4 Factors for Calculating Three Sigma Limits for the X-Chart and R-hart Size of Factor for UCL und Factor for Factor for Sample LCL
Step by Step Solution
There are 3 Steps involved in it
Step: 1

Get Instant Access to Expert-Tailored Solutions
See step-by-step solutions with expert insights and AI powered tools for academic success
Step: 2

Step: 3
Ace Your Homework with AI
Get the answers you need in no time with our AI-driven, step-by-step assistance
Get Started