

Answered step by step
Verified Expert Solution
Question
1 Approved Answer
2. (50 points) The Air Quality Index (AQI) depends on air pollution in a particular location. The AQI is a color-coded index. The colors are
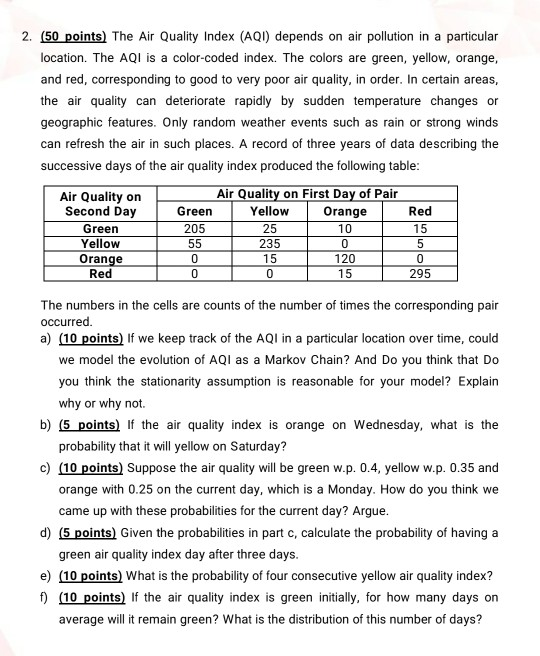
2. (50 points) The Air Quality Index (AQI) depends on air pollution in a particular location. The AQI is a color-coded index. The colors are green, yellow, orange, and red, corresponding to good to very poor air quality, in order. In certain areas, the air quality can deteriorate rapidly by sudden temperature changes or geographic features. Only random weather events such as rain or strong winds can refresh the air in such places. A record of three years of data describing the successive days of the air quality index produced the following table: Air Quality on Air Quality on First Day of Pair Second Day Orange Red Green 205 25 15 Yellow Orange 0 15 120 0 Red Green Yellow 10 0 55 235 5 0 0 15 295 The numbers in the cells are counts of the number of times the corresponding pair occurred. a) (10 points) If we keep track of the AQI in a particular location over time, could we model the evolution of AQI as a Markov Chain? And Do you think that do you think the stationarity assumption is reasonable for your model? Explain why or why not b) (5 points) If the air quality index is orange on Wednesday, what is the probability that it will yellow on Saturday? c) (10 points) Suppose the air quality will be green w.p. 0.4, yellow w.p. 0.35 and orange with 0.25 on the current day, which is a Monday. How do you think we came up with these probabilities for the current day? Argue. d) (5 points) Given the probabilities in part c, calculate the probability of having a green air quality index day after three days. e) (10 points) What is the probability of four consecutive yellow air quality index? A) (10 points) If the air quality index is green initially, for how many days on average will it remain green? What is the distribution of this number of days? 2. (50 points) The Air Quality Index (AQI) depends on air pollution in a particular location. The AQI is a color-coded index. The colors are green, yellow, orange, and red, corresponding to good to very poor air quality, in order. In certain areas, the air quality can deteriorate rapidly by sudden temperature changes or geographic features. Only random weather events such as rain or strong winds can refresh the air in such places. A record of three years of data describing the successive days of the air quality index produced the following table: Air Quality on Air Quality on First Day of Pair Second Day Orange Red Green 205 25 15 Yellow Orange 0 15 120 0 Red Green Yellow 10 0 55 235 5 0 0 15 295 The numbers in the cells are counts of the number of times the corresponding pair occurred. a) (10 points) If we keep track of the AQI in a particular location over time, could we model the evolution of AQI as a Markov Chain? And Do you think that do you think the stationarity assumption is reasonable for your model? Explain why or why not b) (5 points) If the air quality index is orange on Wednesday, what is the probability that it will yellow on Saturday? c) (10 points) Suppose the air quality will be green w.p. 0.4, yellow w.p. 0.35 and orange with 0.25 on the current day, which is a Monday. How do you think we came up with these probabilities for the current day? Argue. d) (5 points) Given the probabilities in part c, calculate the probability of having a green air quality index day after three days. e) (10 points) What is the probability of four consecutive yellow air quality index? A) (10 points) If the air quality index is green initially, for how many days on average will it remain green? What is the distribution of this number of days
Step by Step Solution
There are 3 Steps involved in it
Step: 1

Get Instant Access to Expert-Tailored Solutions
See step-by-step solutions with expert insights and AI powered tools for academic success
Step: 2

Step: 3
Ace Your Homework with AI
Get the answers you need in no time with our AI-driven, step-by-step assistance
Get Started
Management Accounting Information for Decision-Making and Strategy Execution
Authors: Anthony A. Atkinson, Robert S. Kaplan, Ella Mae Matsumura, S. Mark Young
6th Edition
137024975, 978-0137024971