

Answered step by step
Verified Expert Solution
Question
1 Approved Answer
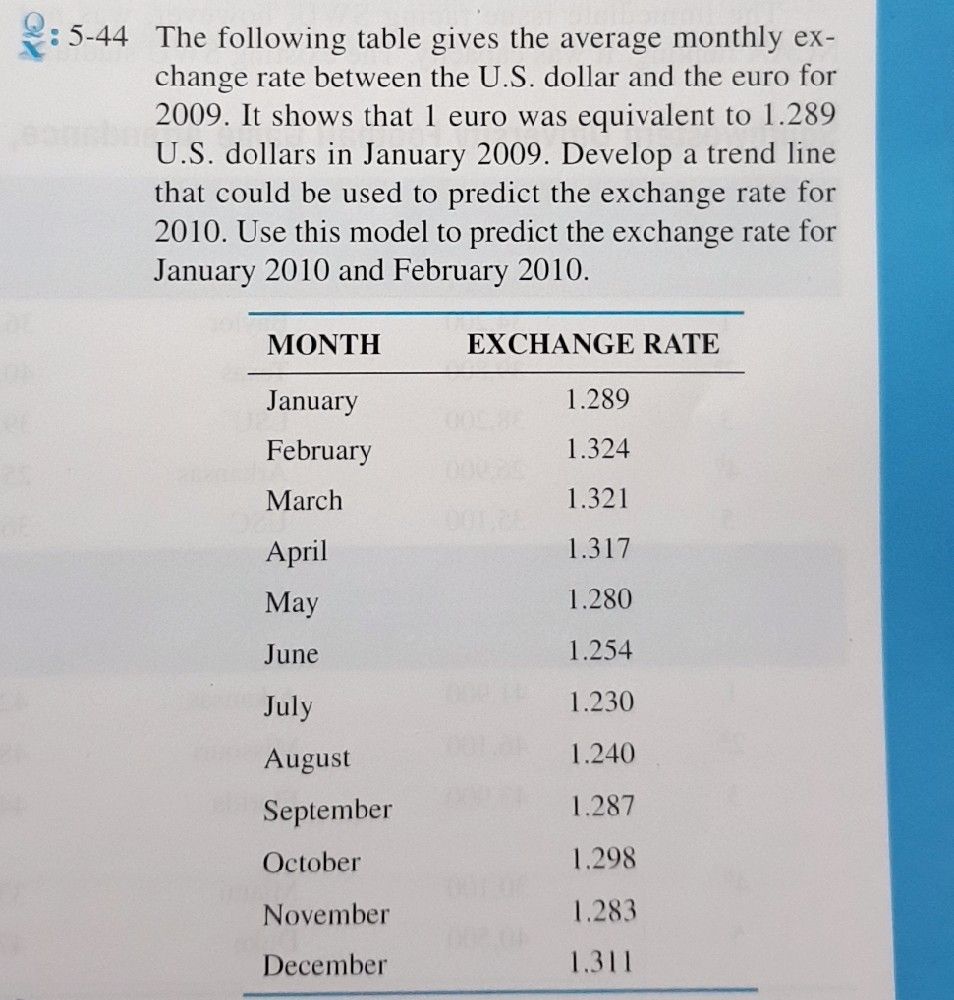
2: 5-44 The following table gives the average monthly ex- change rate between the U.S. dollar and the euro for 2009. It shows that 1
Step by Step Solution
There are 3 Steps involved in it
Step: 1

Get Instant Access to Expert-Tailored Solutions
See step-by-step solutions with expert insights and AI powered tools for academic success
Step: 2

Step: 3
Ace Your Homework with AI
Get the answers you need in no time with our AI-driven, step-by-step assistance
Get Started
Advanced Engineering Mathematics
Authors: Erwin Kreyszig
8th Edition
471154962, 978-0471154969