Answered step by step
Verified Expert Solution
Link Copied!

Question

1 Approved Answer

2. [60 points] Consider a Ramsey growth model with the following CRRA utility function u(c)=1c11 and the Cobb-Douglas production function Y(t)=BK(t)L(t)1, where B>0 is a
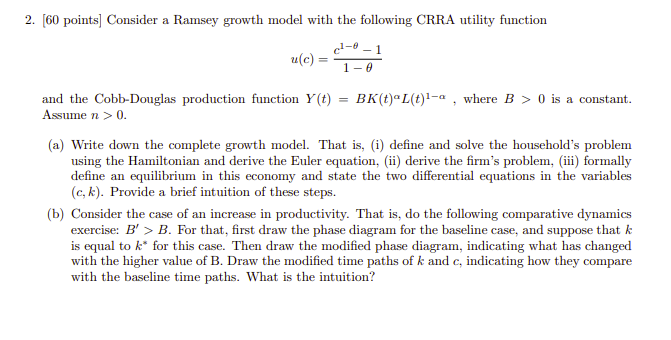
image text in transcribed

2. [60 points] Consider a Ramsey growth model with the following CRRA utility function u(c)=1c11 and the Cobb-Douglas production function Y(t)=BK(t)L(t)1, where B>0 is a constant. Assume n>0. (a) Write down the complete growth model. That is, (i) define and solve the household's problem using the Hamiltonian and derive the Euler equation, (ii) derive the firm's problem, (iii) formally define an equilibrium in this economy and state the two differential equations in the variables (c,k). Provide a brief intuition of these steps. (b) Consider the case of an increase in productivity. That is, do the following comparative dynamics exercise: B>B. For that, first draw the phase diagram for the baseline case, and suppose that k is equal to k for this case. Then draw the modified phase diagram, indicating what has changed with the higher value of B. Draw the modified time paths of k and c, indicating how they compare with the baseline time paths. What is the intuition? 2. [60 points] Consider a Ramsey growth model with the following CRRA utility function u(c)=1c11 and the Cobb-Douglas production function Y(t)=BK(t)L(t)1, where B>0 is a constant. Assume n>0. (a) Write down the complete growth model. That is, (i) define and solve the household's problem using the Hamiltonian and derive the Euler equation, (ii) derive the firm's problem, (iii) formally define an equilibrium in this economy and state the two differential equations in the variables (c,k). Provide a brief intuition of these steps. (b) Consider the case of an increase in productivity. That is, do the following comparative dynamics exercise: B>B. For that, first draw the phase diagram for the baseline case, and suppose that k is equal to k for this case. Then draw the modified phase diagram, indicating what has changed with the higher value of B. Draw the modified time paths of k and c, indicating how they compare with the baseline time paths. What is the intuition

Step by Step Solution

There are 3 Steps involved in it

Step: 1

blur-text-image

Get Instant Access to Expert-Tailored Solutions

See step-by-step solutions with expert insights and AI powered tools for academic success

Step: 2

blur-text-image

Step: 3

blur-text-image

Ace Your Homework with AI

Get the answers you need in no time with our AI-driven, step-by-step assistance

Get Started

Recommended Textbook for

Waste Management And Environmental Auditing Of An Urban Road Project

Authors: Babagana Mohammed, Salim Mohammed Sani

1st Edition

3330344563, 978-3330344563

More Books

Students also viewed these Accounting questions