Answered step by step
Verified Expert Solution
Question
1 Approved Answer
2 7. Ten analysts have given the following fiscal year earnings forecasts for a stock: Forecast (X;) Number of Analysts (n;) 1.40 1 1.43 1
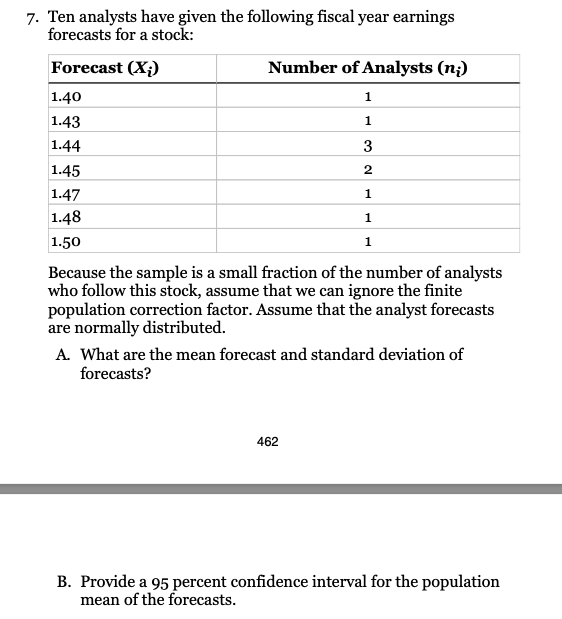
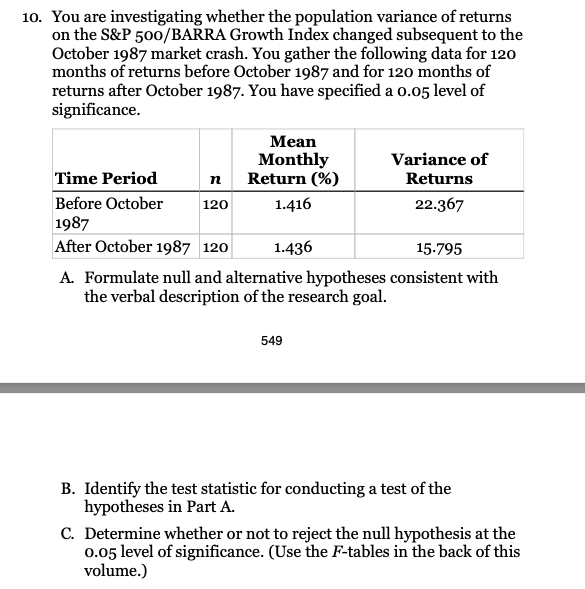
2 7. Ten analysts have given the following fiscal year earnings forecasts for a stock: Forecast (X;) Number of Analysts (n;) 1.40 1 1.43 1 1.44 3 1.45 1.47 1.48 1.50 1 Because the sample is a small fraction of the number of analysts who follow this stock, assume that we can ignore the finite population correction factor. Assume that the analyst forecasts are normally distributed. A. What are the mean forecast and standard deviation of forecasts? 1 1 462 B. Provide a 95 percent confidence interval for the population mean of the forecasts. 10. You are investigating whether the population variance of returns on the S&P 500/BARRA Growth Index changed subsequent to the October 1987 market crash. You gather the following data for 120 months of returns before October 1987 and for 120 months of returns after October 1987. You have specified a 0.05 level of significance. Mean Monthly Variance of Time Period n Return (%) Returns Before October 120 1.416 22.367 1987 After October 1987 120 1.436 15.795 A. Formulate null and alternative hypotheses consistent with the verbal description of the research goal. 549 B. Identify the test statistic for conducting a test of the hypotheses in Part A. C. Determine whether or not to reject the null hypothesis at the 0.05 level of significance. (Use the F-tables in the back of this volume.)
Step by Step Solution
There are 3 Steps involved in it
Step: 1
Get Instant Access to Expert-Tailored Solutions
See step-by-step solutions with expert insights and AI powered tools for academic success
Step: 2
Step: 3
Ace Your Homework with AI
Get the answers you need in no time with our AI-driven, step-by-step assistance
Get Started