Question
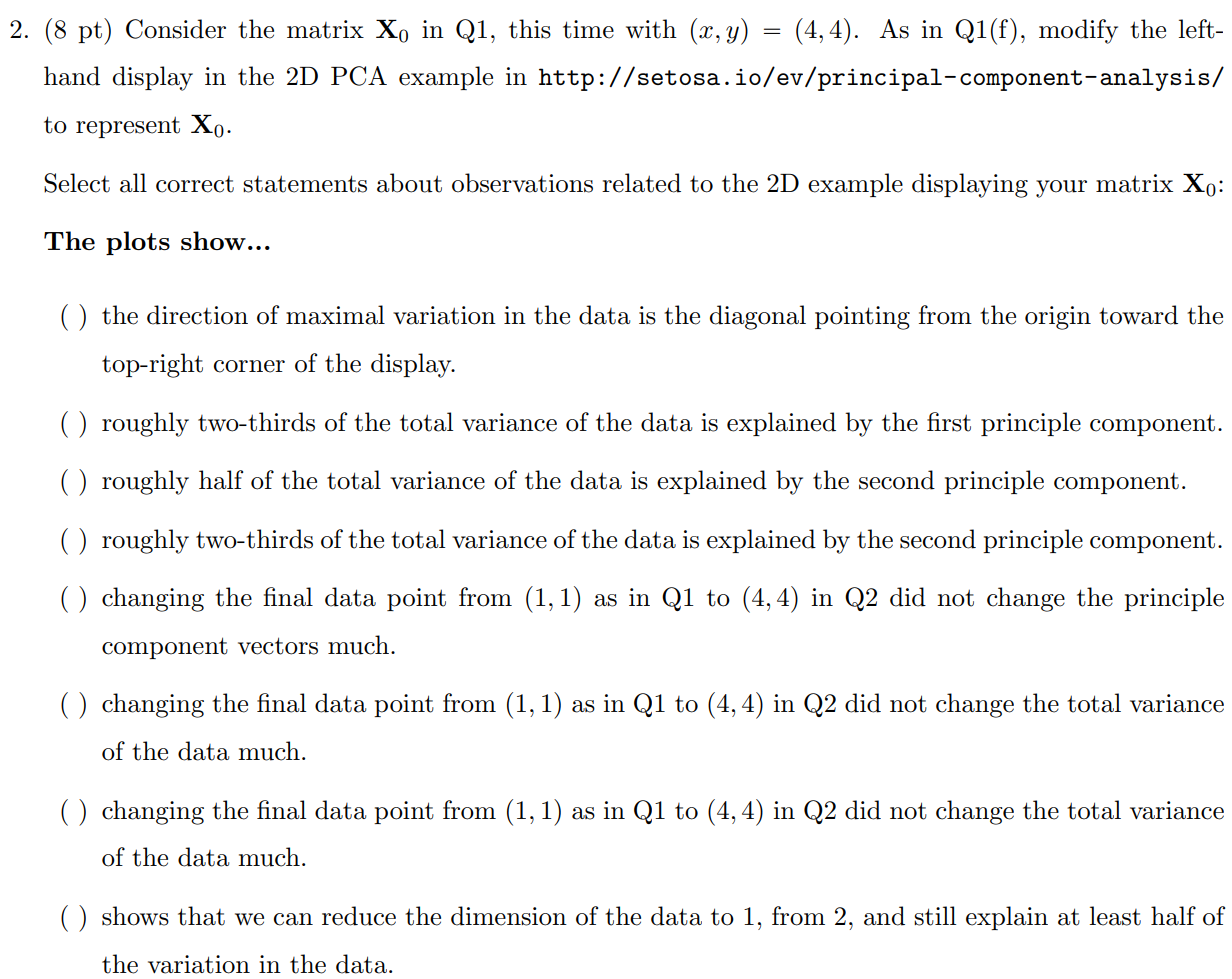
2. (8 pt) Consider the matrix X0 in Q1, this time with px, yq p4, 4q. As in Q1(f), modify the lefthand display in
2. (8 pt) Consider the matrix X0 in Q1, this time with px, yq " p4, 4q. As in Q1(f), modify the lefthand display in the 2D PCA example in http://setosa.io/ev/principal-component-analysis/ to represent X0. Select all correct statements about observations related to the 2D example displaying your matrix X0: The plots show... ( ) the direction of maximal variation in the data is the diagonal pointing from the origin toward the top-right corner of the display. ( ) roughly two-thirds of the total variance of the data is explained by the first principle component. ( ) roughly half of the total variance of the data is explained by the second principle component. ( ) roughly two-thirds of the total variance of the data is explained by the second principle component. ( ) changing the final data point from p1, 1q as in Q1 to p4, 4q in Q2 did not change the principle component vectors much. ( ) changing the final data point from p1, 1q as in Q1 to p4, 4q in Q2 did not change the total variance of the data much. ( ) changing the final data point from p1, 1q as in Q1 to p4, 4q in Q2 did not change the total variance of the data much. ( ) shows that we can reduce the dimension of the data to 1, from 2, and still explain at least half of the variation in the data.

Step by Step Solution
There are 3 Steps involved in it
Step: 1

Get Instant Access to Expert-Tailored Solutions
See step-by-step solutions with expert insights and AI powered tools for academic success
Step: 2

Step: 3

Ace Your Homework with AI
Get the answers you need in no time with our AI-driven, step-by-step assistance
Get Started


