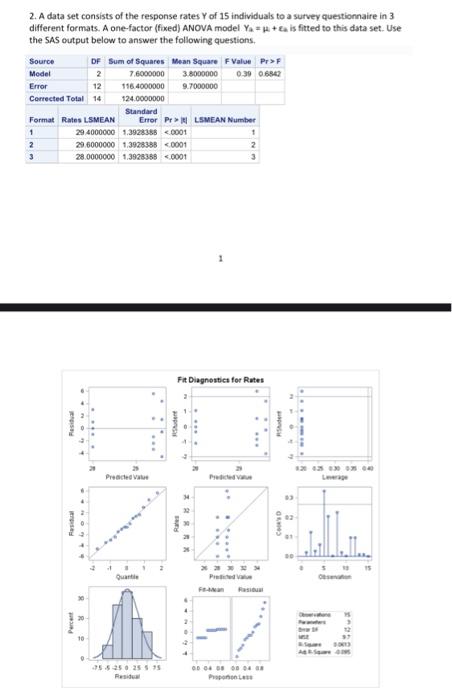
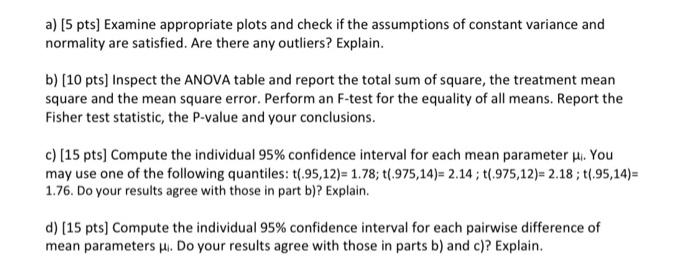
2. A data set consists of the response rates Y of 15 individuals to a survey questionnaire in 3 different formats . A one-factor (fixed) ANOVA model Y = 1 + Ea is fitted to this data set. Use the SAS output below to answer the following questions, Source DF Sum of Squares Mean Square F Value Pr>F Model 7.6000000 3.8000000 0-30 0642 Error 12 116.4000000 9.7000000 Corrected Total 14 124.0000000 Standard Format Rates LSMEAN Error Pr> LSMEAN Number 1 29.4000000 1.3928388 10 -15.5 25 25 5 5 0 0 0 0 4 POL a) [5 pts) Examine appropriate plots and check if the assumptions of constant variance and normality are satisfied. Are there any outliers? Explain. b) (10 pts) Inspect the ANOVA table and report the total sum of square, the treatment mean square and the mean square error. Perform an F-test for the equality of all means. Report the Fisher test statistic, the P-value and your conclusions. c) (15 pts) Compute the individual 95% confidence interval for each mean parameter . You may use one of the following quantiles: t(.95,12)= 1.78; t(.975,14)= 2.14; t(.975,12)= 2.18; t(.95,14)= 1.76. Do your results agree with those in part b)? Explain. d) (15 pts) Compute the individual 95% confidence interval for each pairwise difference of mean parameters H. Do your results agree with those in parts b) and c)? Explain. 2. A data set consists of the response rates Y of 15 individuals to a survey questionnaire in 3 different formats . A one-factor (fixed) ANOVA model Y = 1 + Ea is fitted to this data set. Use the SAS output below to answer the following questions, Source DF Sum of Squares Mean Square F Value Pr>F Model 7.6000000 3.8000000 0-30 0642 Error 12 116.4000000 9.7000000 Corrected Total 14 124.0000000 Standard Format Rates LSMEAN Error Pr> LSMEAN Number 1 29.4000000 1.3928388 10 -15.5 25 25 5 5 0 0 0 0 4 POL a) [5 pts) Examine appropriate plots and check if the assumptions of constant variance and normality are satisfied. Are there any outliers? Explain. b) (10 pts) Inspect the ANOVA table and report the total sum of square, the treatment mean square and the mean square error. Perform an F-test for the equality of all means. Report the Fisher test statistic, the P-value and your conclusions. c) (15 pts) Compute the individual 95% confidence interval for each mean parameter . You may use one of the following quantiles: t(.95,12)= 1.78; t(.975,14)= 2.14; t(.975,12)= 2.18; t(.95,14)= 1.76. Do your results agree with those in part b)? Explain. d) (15 pts) Compute the individual 95% confidence interval for each pairwise difference of mean parameters H. Do your results agree with those in parts b) and c)? Explain


