

2. A liquid is heated in a lab using a hot plate. The graph of temperature vs. time is as follows. Temperature of Solution
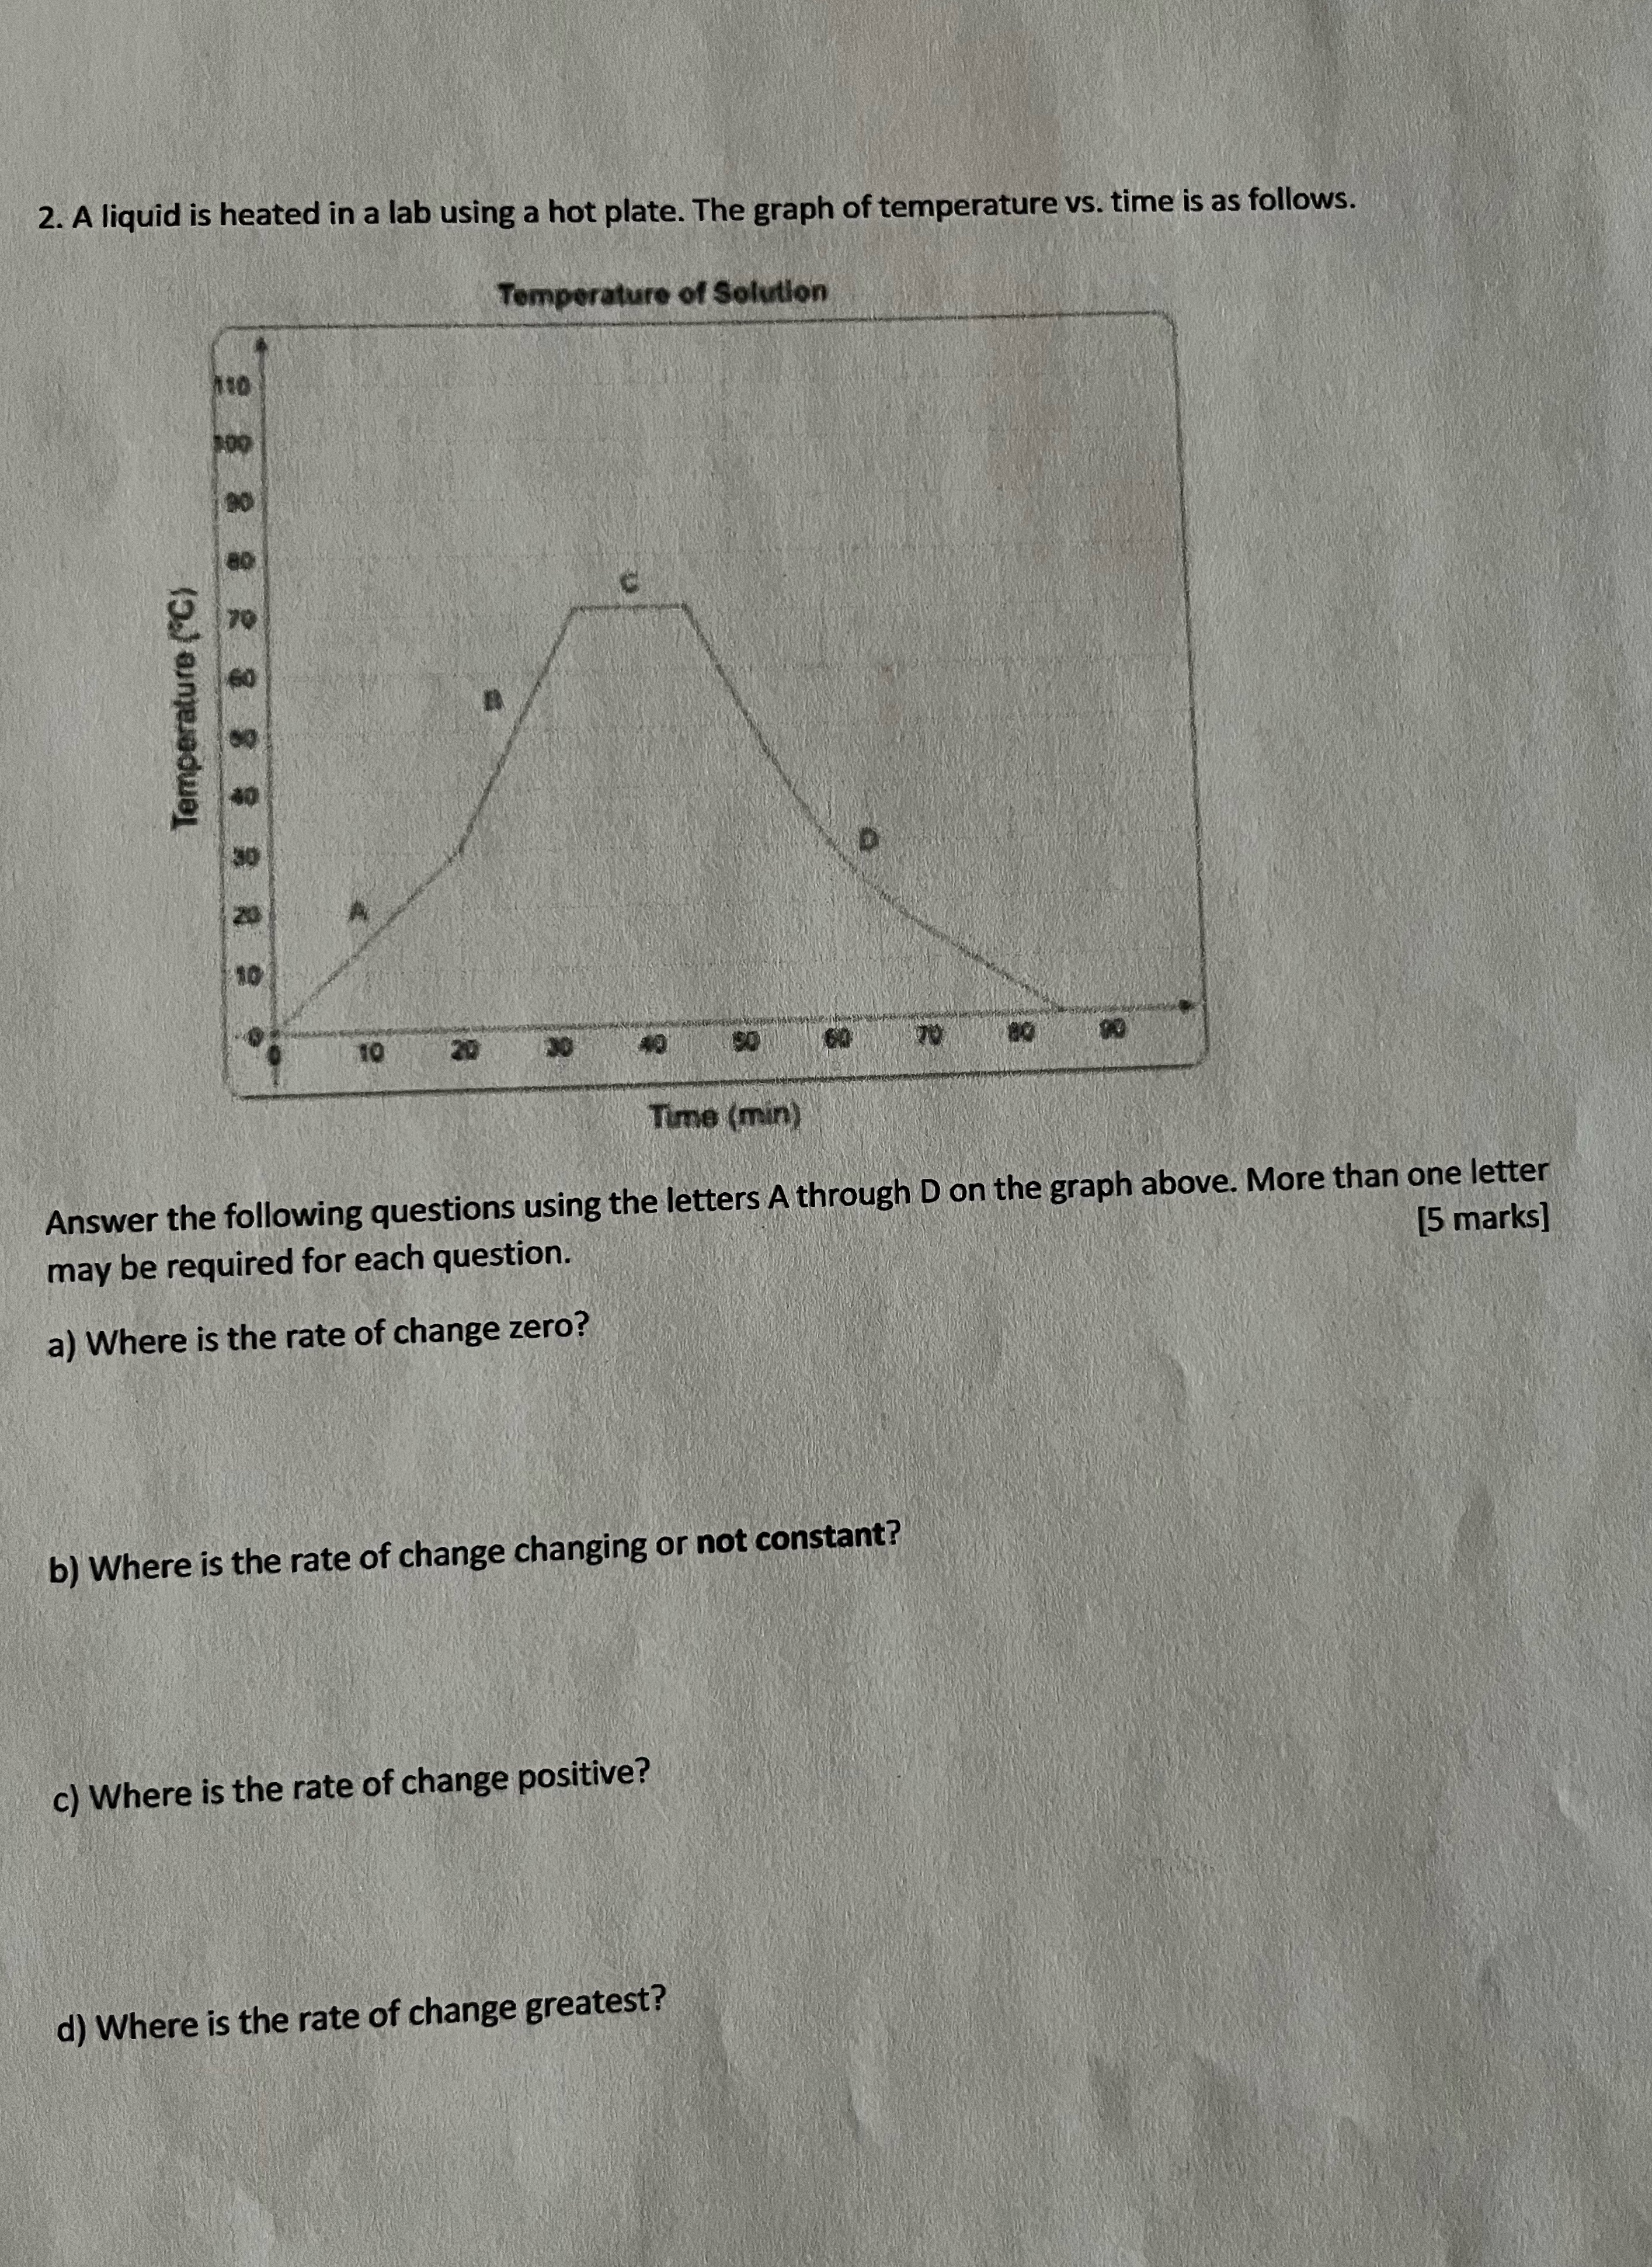
2. A liquid is heated in a lab using a hot plate. The graph of temperature vs. time is as follows. Temperature of Solution Temperature (C) 888R 8 8 8 8 8 9 110 200 10 20 40 50 60 70 90 Time (min) Answer the following questions using the letters A through D on the graph above. More than one letter may be required for each question. a) Where is the rate of change zero? [5 marks] b) Where is the rate of change changing or not constant? c) Where is the rate of change positive? d) Where is the rate of change greatest?
Step by Step Solution
There are 3 Steps involved in it
Step: 1
Lets analyze the graph step by step to answer the given questions a Where is the rate of change zero ... View full answer

Get step-by-step solutions from verified subject matter experts
100% Satisfaction Guaranteed-or Get a Refund!
Step: 2Unlock detailed examples and clear explanations to master concepts

Step: 3Unlock to practice, ask and learn with real-world examples
See step-by-step solutions with expert insights and AI powered tools for academic success
-
 Access 30 Million+ textbook solutions.
-
Ask unlimited questions from AI Tutors.
-
Order free textbooks.
-
100% Satisfaction Guaranteed-or Get a Refund!
Claim Your Hoodie Now!
Authors: L. G. Wade Jr.
8th edition
321768418, 978-0321768414

Study Smart with AI Flashcards
Access a vast library of flashcards, create your own, and experience a game-changing transformation in how you learn and retain knowledge
Explore Flashcards

