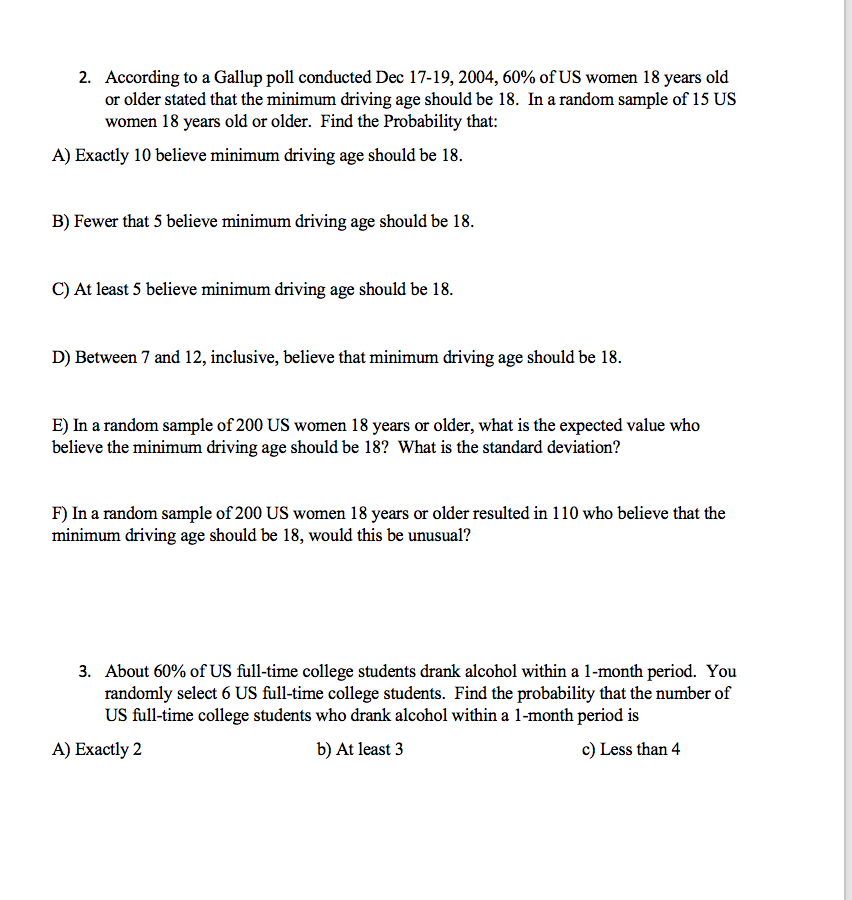
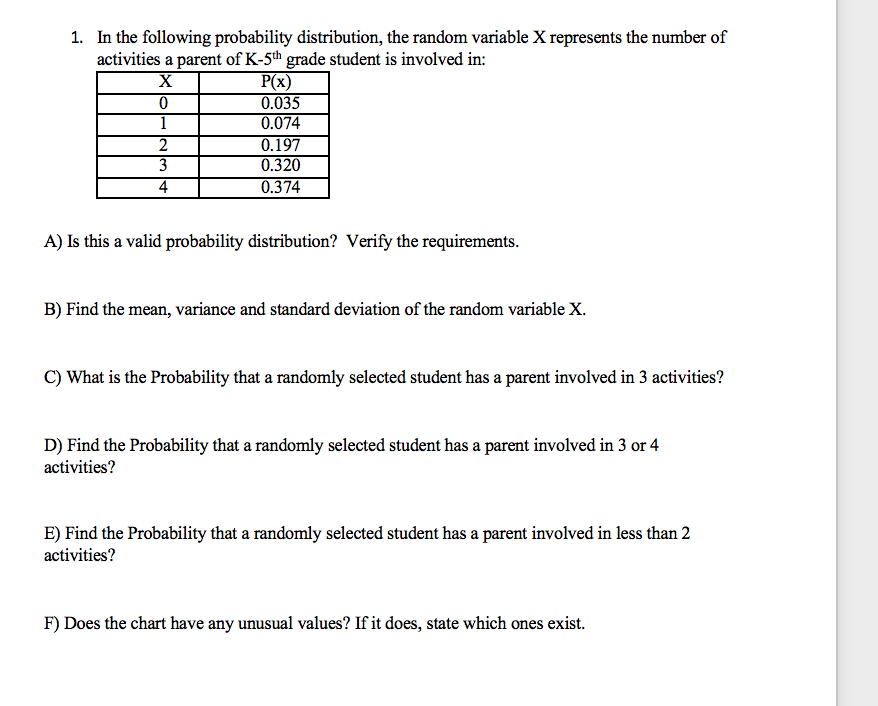
2. According to a Gallup poll conducted Dec 17-19, 2004, 60% of US women 18 years old or older stated that the minimum driving age should be 18. In arandom sample of 15 US women 18 years old or older. Find the Pmbability that: A) Exactly 10 believe minimum driving age should be 18. B) Fewer that 5 believe minimum driving age should be 18. C) At least 5 believe minimum driving age should be 18. D) Between 7 and 12, inclusive, believe that minimum driving age should be 18. E) In a random sample of 200 US women 18 years or older, what is the expected value who believe the minimum driving age should be 18? What is the standard deviation? F) In a random sample of200 US women 18 years or older resulted in 110 who believe that the minimum driving age should be 18, would this be unusual? 3. About 60% of US tll-time college students drank alcohol within a 1-month period. You randomly select 6 US full-time college students. Find the probability that the number of US full-time college students who drank alcohol within a 1-month period is A) Exactly 2 b) At least 3 c) Less than 4 1. In the following probability distribution, the random variable X represents the number of activities a parent of K-5th grade student is involved in: X P(x) 0 0.035 0.074 0.197 AWN - 0.320 0.374 A) Is this a valid probability distribution? Verify the requirements. B) Find the mean, variance and standard deviation of the random variable X. C) What is the Probability that a randomly selected student has a parent involved in 3 activities? D) Find the Probability that a randomly selected student has a parent involved in 3 or 4 activities? E) Find the Probability that a randomly selected student has a parent involved in less than 2 activities? F) Does the chart have any unusual values? If it does, state which ones exist