Answered step by step
Verified Expert Solution
Question
1 Approved Answer
2. Analyze the structure of the income statement over the 3 years. a. Analyze percentage changes in the companys different profit measures. b. Analyze growth

 2. Analyze the structure of the income statement over the 3 years.
a. Analyze percentage changes in the companys different profit measures. b. Analyze growth over the three years of the companys revenues. c. What general conclusions can be drawn from your analysis of 2a and 2b
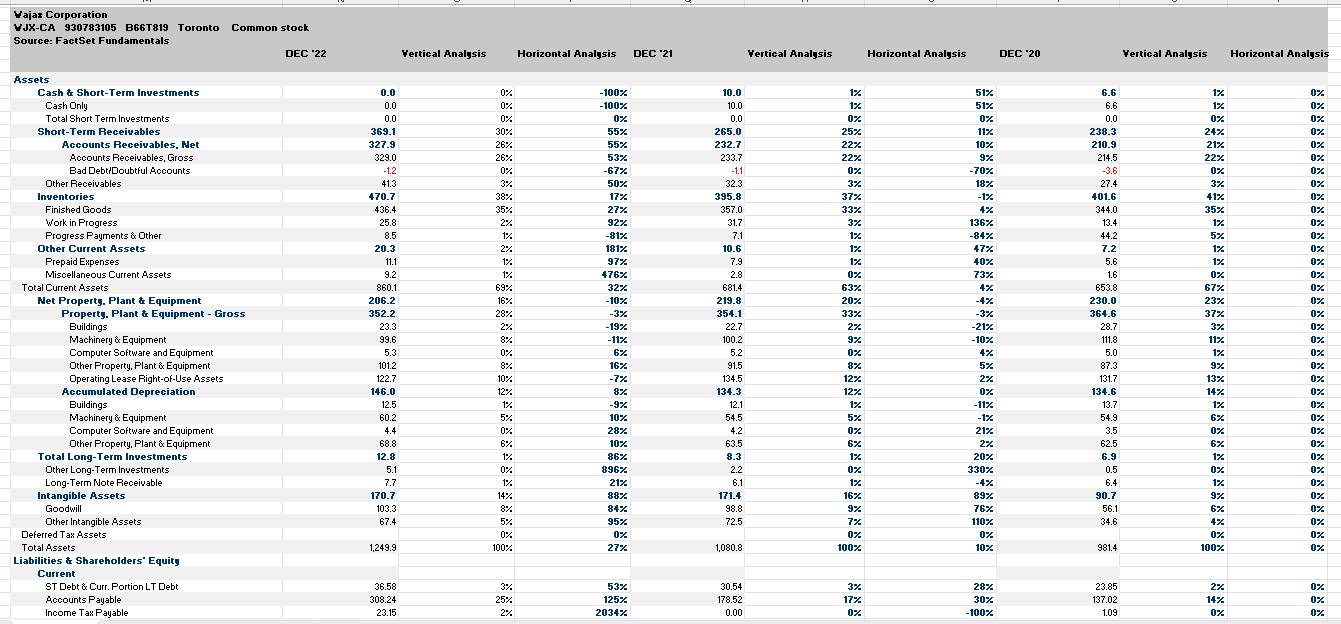
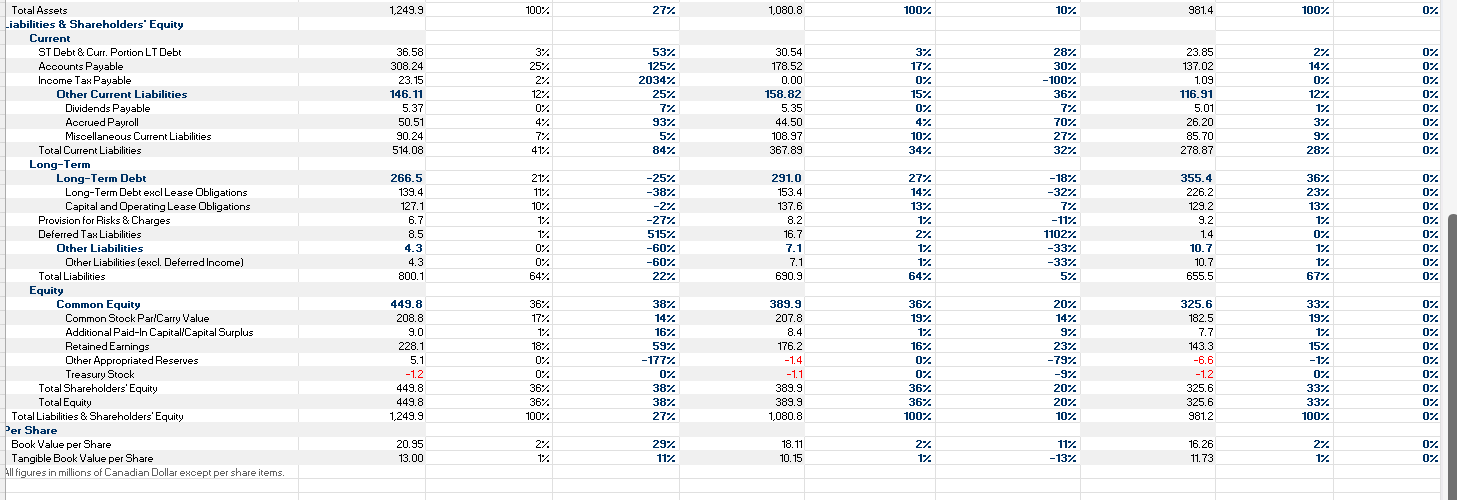
\begin{tabular}{|c|c|c|c|c|c|c|c|c|c|} \hline YajazCorporationYJX-CA930783105B66T819TorontoConSource:FactSetFundamentals & stockDEC22 & Yertical Analysis & Horizontal Analysis & DEC 21 & Yertical Analysis & Horizontal Analysis & DEC 20 & Yertical Analysis & Horizontal Analysis \\ \hline \multicolumn{10}{|l|}{ Assets } \\ \hline Cash t Short-Term Investments & 0.0 & 0% & 100% & 10.0 & 1\% & 51% & 6.6 & 1\% & 0% \\ \hline Cash Only & 0.0 & 0% & 100% & 10.0 & 1% & 51% & 6.6 & 1% & 0% \\ \hline Total Short Term Investments & 0.0 & 0% & 0% & 0.0 & 0% & 0% & 0.0 & 0 & 0% \\ \hline Short-Term Receivables & 369.1 & 30% & 55% & 265.0 & 25% & 11% & 238.3 & 24\% & 0% \\ \hline Accounts Receivables. Net & 327.9 & 26% & 55% & 232.7 & 22% & 10% & 210.9 & 21% & 0% \\ \hline Accounts Receivables, Gross & 329.0 & 26% & 53% & 233.7 & 22% & 9% & 214.5 & 22% & 0% \\ \hline Bad DebtiDoubtful Accounts & -1.2 & 0% & 67% & -1.1 & 0% & 70% & -3.6 & 0% & 0% \\ \hline Other Receivables & 41.3 & 3% & 50% & 32.3 & 3% & 18% & 27.4 & 3% & 0% \\ \hline Inventories & 470.7 & 38% & 17% & 395.8 & 37% & 1% & 401.6 & 41% & 0% \\ \hline Finished Goods & 436.4 & 35% & 27% & 357.0 & 33% & 4% & 344.0 & 35% & 0% \\ \hline Work in Progress & 25.8 & 2% & 92% & 31.7 & 3% & 136% & 13.4 & 1\% & 0% \\ \hline Progress Payments \& Qther & 8.5 & % & 81% & 7.1 & 1% & 84% & 44.2 & 5% & 0% \\ \hline Other Current Assets & 20.3 & 2% & 181% & 10.6 & 1% & 47% & 7.2 & 1% & 0% \\ \hline Prepaid Expenses & 11.1 & 1% & 97% & 7.9 & 1% & 40% & 5.6 & 1% & 0% \\ \hline Miscellaneous Current Assets & 9.2 & % & 476% & 2.8 & 0% & 73% & 1.6 & 0 & 0% \\ \hline Total Current Assets & 860.1 & 69% & 32% & 681.4 & 63\% & 4% & 653.8 & 67% & 0% \\ \hline Net Property. Plant \& Equipment & 206.2 & 16% & 10% & 219.8 & 20\% & 4% & 230.0 & 23% & 0% \\ \hline Property. Plant t Equipment - Gross & 352.2 & 28% & 3% & 354.1 & 33% & 3% & 364.6 & 37% & 0% \\ \hline Buildings & 23.3 & 2% & 19% & 22.7 & 2% & 21% & 28.7 & 3% & 0% \\ \hline Machinery \& Equipment & 99.6 & 8% & 11% & 100.2 & 9% & 10% & 111.8 & 11% & 0% \\ \hline Computer Software and Equipment & 5.3 & 0% & 6% & 5.2 & 0% & 4% & 5.0 & 1% & 0% \\ \hline Other Froperty. Flant \& Equipment & 101.2 & 8% & 16% & 91.5 & 8% & 5% & 87.3 & 9% & 0% \\ \hline Operating Lease Right-of-Use Assets & 122.7 & 10% & 7% & 134.5 & 12% & 2% & 131.7 & 13% & 0% \\ \hline Accumulated Depreciation & 146.0 & 12% & 8% & 134.3 & 12% & 0% & 134.6 & 14% & 0% \\ \hline Buildings & 12.5 & % & 9% & 12.1 & 1% & 11% & 13.7 & 1% & 0% \\ \hline Machinery \& Equipment & 60.2 & 5% & 10% & 54.5 & 5% & 1% & 54.9 & 6% & 0% \\ \hline Computer Software and Equipment & 4.44.4 & 0% & 28% & 4.2 & 0% & 21% & 3.5 & 0% & 0% \\ \hline Other Property, Plant \& Equipment & 68.8 & 6% & 10% & 63.5 & 6% & 2% & 62.5 & 6% & 0% \\ \hline Total Long-Term Investments & 12.8 & 1% & 86% & 8.3 & 1% & 20% & 6.9 & 1\% & 0% \\ \hline Other Long-Term Investments & 5.1 & 0% & 896% & 2.2 & 0\% & 330% & 0.5 & 0% & 0% \\ \hline Long-Term Note Receivable & 7.7 & % & 21% & 6.1 & 1% & 4% & 6.4 & 1% & 0% \\ \hline Intangible Assets & 170.7 & 14% & 88% & 171.4 & 16% & 89% & 90.7 & 9% & 0% \\ \hline Goodwill & 103.3 & 8% & 84% & 98.8 & 9% & 76% & 56.1 & 6% & 0% \\ \hline Other Intangible Assets & 67.4 & 5% & 95% & 72.5 & 7% & 110% & 34.6 & 4% & 0 \\ \hline Deferred Tan Assets & & 0% & 0% & & 0% & 0% & & 0% & 0% \\ \hline Total Assets & 1,249.9 & 100% & 27% & 1,080.8 & 100% & 10% & 981.4 & 100% & 0% \\ \hline \multicolumn{10}{|l|}{ Liabilities to Shareholders" Equity } \\ \hline Current & & & & & & & & & \\ \hline ST Debt \& Curr. Portion LT Debt & 36.58 & 3% & 53% & 30.54 & 3% & 28% & 23.85 & 2% & 0% \\ \hline Accounts Payable & 308.24 & 25% & 125% & 178.52 & 17% & 30% & 137.02 & 14% & 0% \\ \hline Income Tax Payable & 23.15 & 2% & 2034\% & 0.00 & 0% & 100% & & 0% & 0% \\ \hline \end{tabular} \begin{tabular}{|c|c|c|c|c|c|c|c|c|c|} \hline Total Assets & 1,249.9 & 100% & 27% & 1,080.8 & 100% & 10% & 981.4 & 100% & 0% \\ \hline \multirow{2}{*}{\multicolumn{10}{|c|}{iabilities&ShareholdersEquityCurrent}} \\ \hline & & & & & & & & & \\ \hline \multicolumn{10}{|l|}{CurrentSTDebt&Curr.PortionLTDebt} \\ \hline Accounts Payable & 308.24 & 25% & 125% & 178.52 & 17% & 30% & 137.02 & 14% & 0% \\ \hline Income Tax Payable & 23.15 & 2% & 2034% & 0.00 & 0% & 100% & 1.09 & 0% & 0% \\ \hline Other Current Liabilities & 146.11 & 12% & 25% & 158.82 & 15% & 36% & 116.91 & 12% & 0% \\ \hline Dividends Payable & 5.37 & 0% & 7% & 5.35 & 0% & 7% & 5.01 & 1% & 0% \\ \hline Acorued Payroll & 50.51 & 4% & 93% & 44.50 & 4% & 70% & 26.20 & 3% & 0% \\ \hline Miscellaneous Current Liabilities & 90.24 & 7% & 5% & 108.97 & 10% & 27% & 85.70 & 9% & 0% \\ \hline Total Current Liabilities & 514.08 & 41% & 84% & 367.89 & 34% & 32% & 278.87 & 28% & 0% \\ \hline \multicolumn{10}{|l|}{ Long-Term } \\ \hline Long-Term Debt & 266.5 & 21% & 25% & 291.0 & 27% & 18% & 355.4 & 36% & 0% \\ \hline Long-Term Debt excl Lease Dbligations & 139.4 & 11% & 38% & 153.4 & 14% & 32% & 226.2 & 23% & 0% \\ \hline Capital and Operating Lease Dbligations & 127.1 & 10% & 2% & 137.6 & 13% & 7% & 129.2 & 13% & 0% \\ \hline Provision for Risks \& Charges & 6.7 & % & 27% & 8.2 & % & 11% & 9.2 & % & 0% \\ \hline Deferred Tax Liabilities & 8.5 & % & 515% & 16.7 & 2% & 1102% & 1.4 & 0% & 0% \\ \hline Other Liabilities & 4.3 & 0% & 60% & 7.1 & 1% & 33% & 10.7 & 1% & 0% \\ \hline Dther Liabilities (excl. Deferred Income) & 4.3 & 0% & 60% & 7.1 & 1% & 33% & 10.7 & 1\% & 0% \\ \hline Total Liabilities & 800.1 & 64% & 22% & 690.9 & 64% & 5% & 655.5 & 67% & 0% \\ \hline \multicolumn{10}{|l|}{ Equity } \\ \hline Common Equity & 449.8 & 36% & 38% & 389.9 & 36% & 20% & 325.6 & 33% & 0% \\ \hline Common Stock ParlCarry Value & 208.8 & 17% & 14% & 207.8 & 19% & 14% & 182.5 & 19% & 0% \\ \hline Additional Paid-In Capitall'Capital Surplus & 9.0 & % & 16% & 8.4 & 1% & 9% & 7.7 & 1\% & 0% \\ \hline RetainedEarnings & 228.1 & 18% & 59% & 176.2 & 16% & 23% & 143.3 & 15% & 0% \\ \hline Dther Appropriated Reserves & 5.1 & 0% & 177% & -1.4 & 0% & 79% & -6.6 & 1% & 0% \\ \hline Treasury Stock & -1.2 & 0% & 0% & -1.1 & 0% & 9% & -1.2 & 0% & 0% \\ \hline Total Shareholders'Equity & 449.8 & 36% & 38% & 389.9 & 36% & 20% & 325.6 & 33% & 0% \\ \hline Total Equity & 449.8 & 36% & 38% & 389.9 & 36% & 20% & 325.6 & 33% & 0% \\ \hline Total Liabilities \& Shareholders' Equity & 1,249.9 & 100% & 27% & 1,080.8 & 100% & 10% & 981.2 & 100% & 0% \\ \hline \multicolumn{10}{|l|}{ Per Share } \\ \hline Book Value per Share & 20.95 & 2% & 29% & 18.11 & 2% & 11% & 16.26 & 2% & 0% \\ \hline Tangible Book Value per Share & 13.00 & 1% & 11% & 10.15 & 1% & 13% & 11.73 & 1% & 0% \\ \hline ill figures in millions of Canadian Dollar except per share & & & & & & & & & \\ \hline \end{tabular}
Step by Step Solution
There are 3 Steps involved in it
Step: 1

Get Instant Access to Expert-Tailored Solutions
See step-by-step solutions with expert insights and AI powered tools for academic success
Step: 2

Step: 3

Ace Your Homework with AI
Get the answers you need in no time with our AI-driven, step-by-step assistance
Get Started


