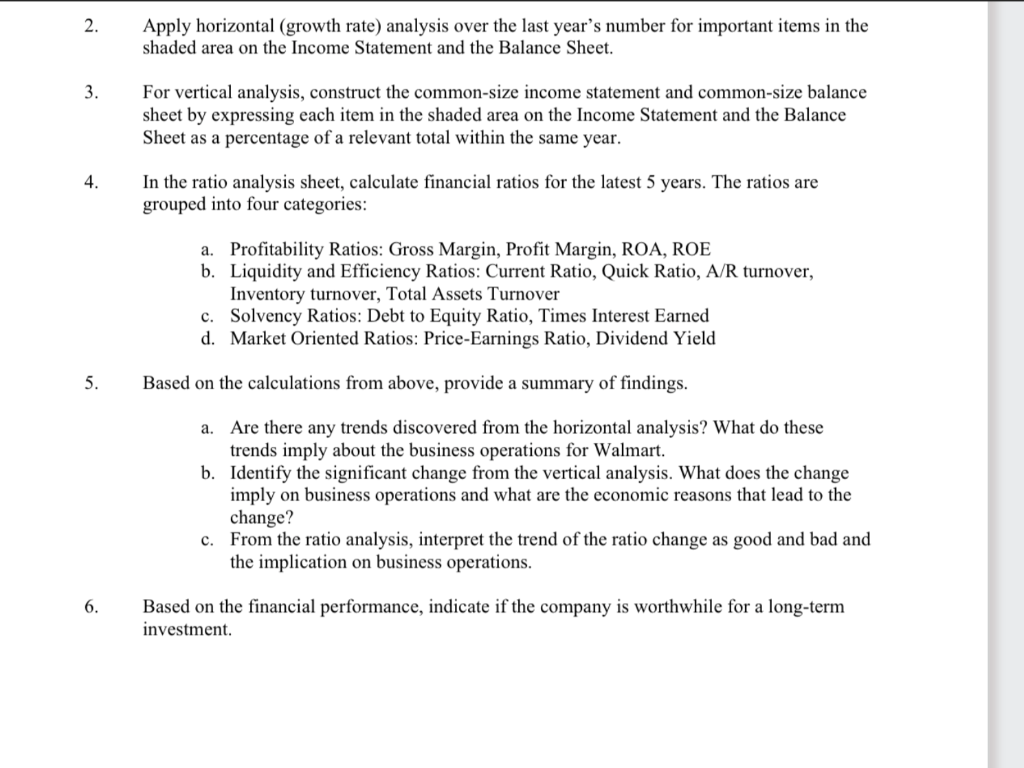
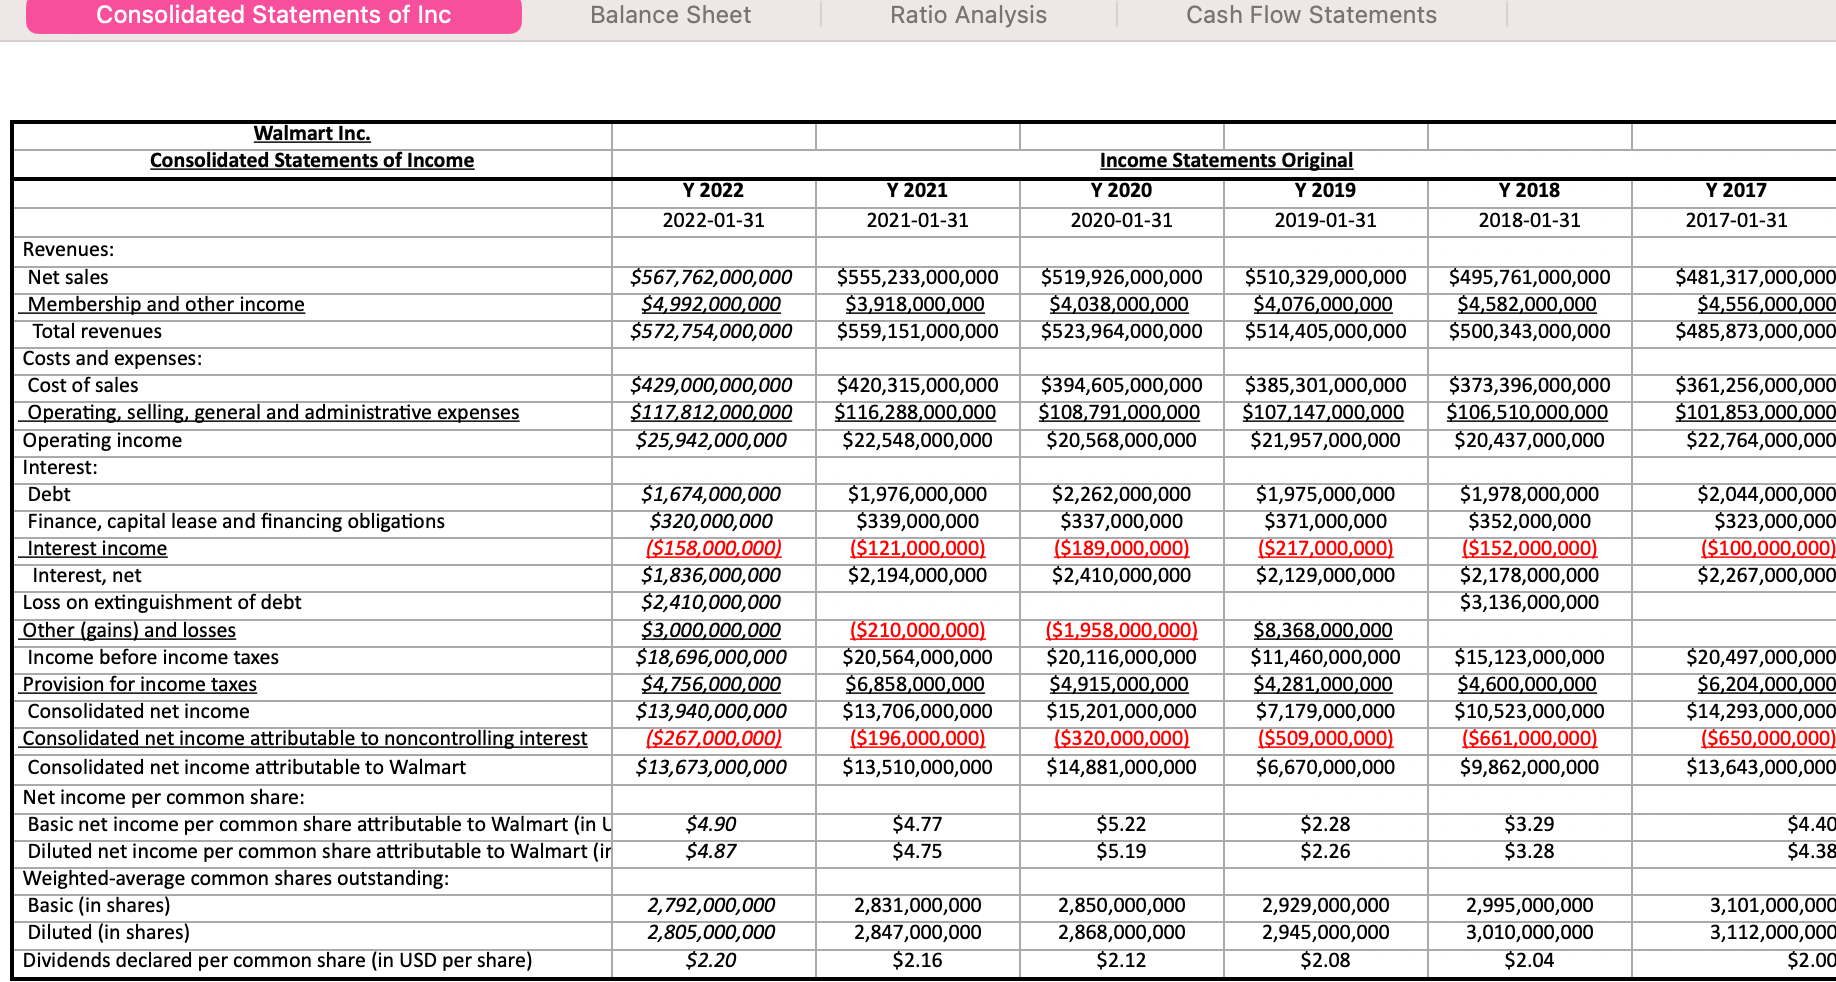
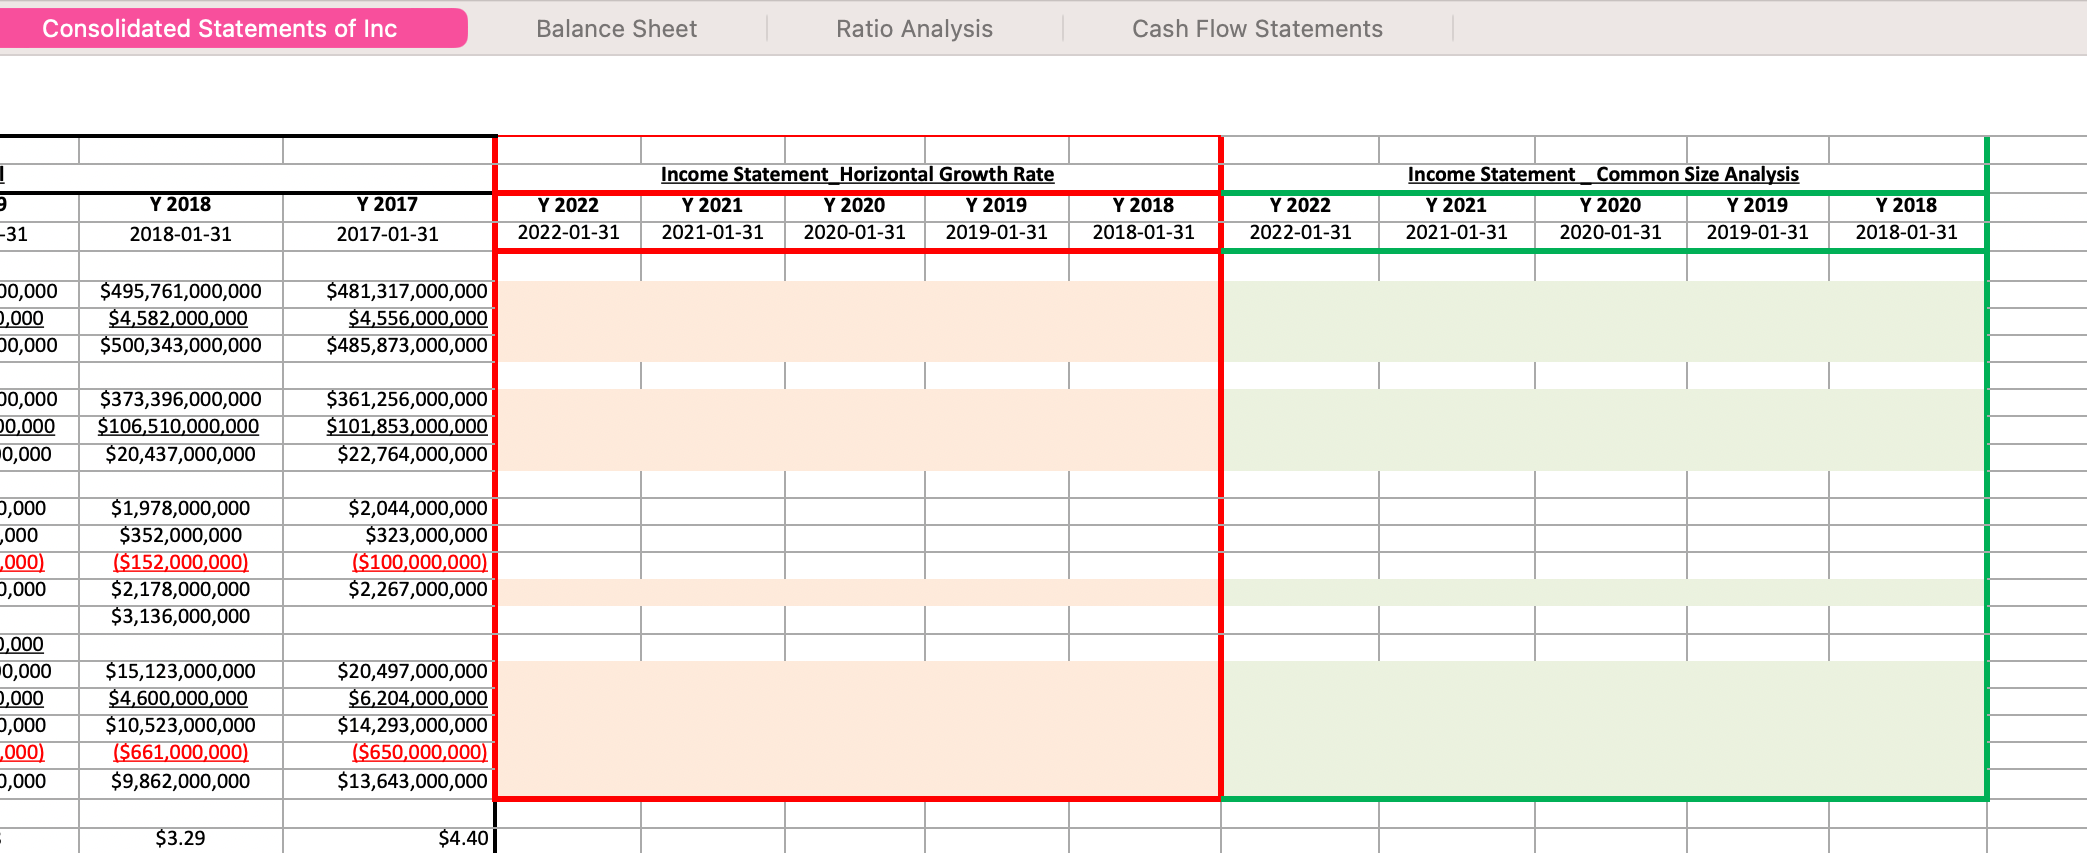
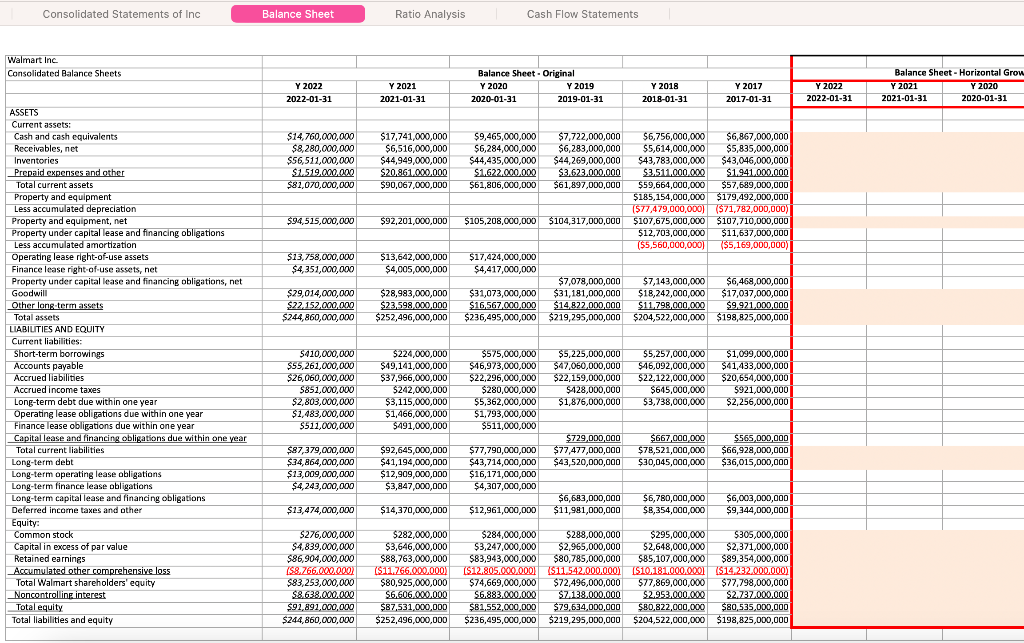
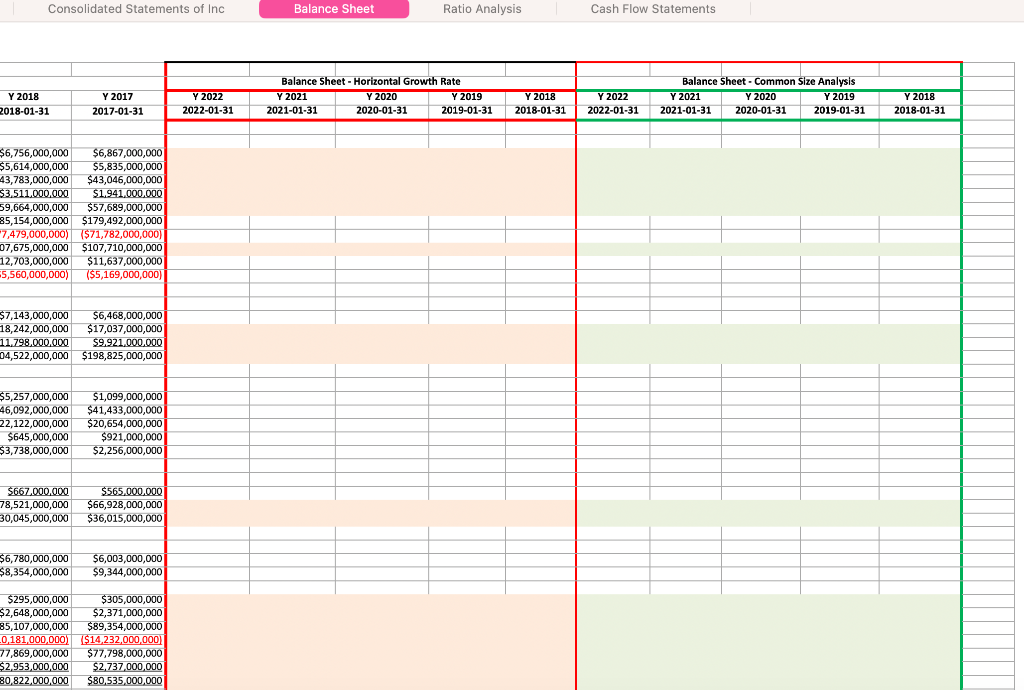
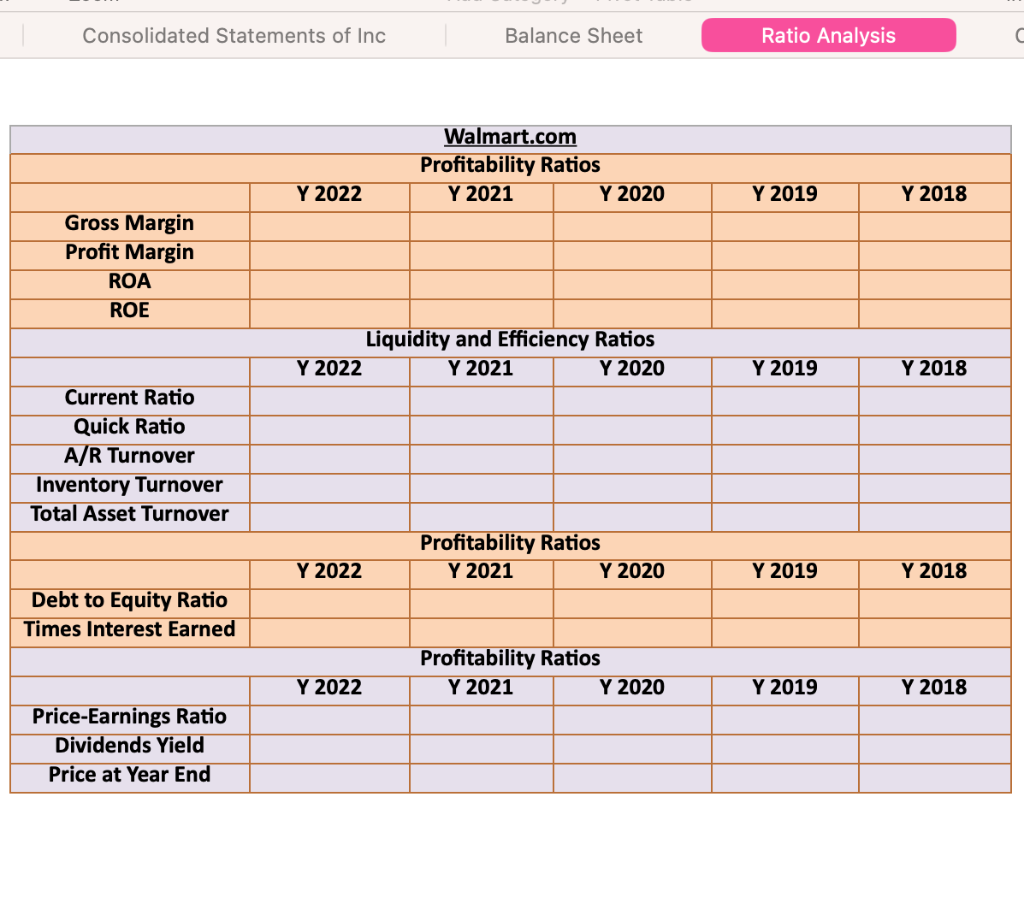
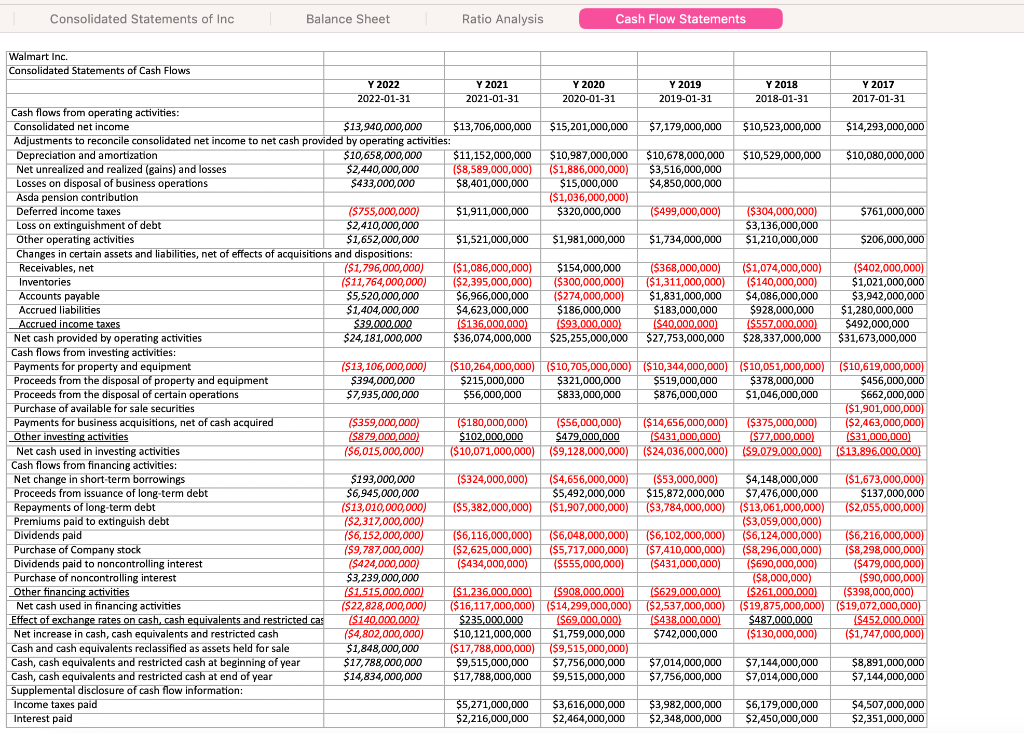
2. Apply horizontal (growth rate) analysis over the last year's number for important items in the shaded area on the Income Statement and the Balance Sheet. 3. For vertical analysis, construct the common-size income statement and common-size balance sheet by expressing each item in the shaded area on the Income Statement and the Balance Sheet as a percentage of a relevant total within the same year. 4. In the ratio analysis sheet, calculate financial ratios for the latest 5 years. The ratios are grouped into four categories: a. Profitability Ratios: Gross Margin, Profit Margin, ROA, ROE b. Liquidity and Efficiency Ratios: Current Ratio, Quick Ratio, A/R turnover, Inventory turnover, Total Assets Turnover c. Solvency Ratios: Debt to Equity Ratio, Times Interest Earned d. Market Oriented Ratios: Price-Earnings Ratio, Dividend Yield 5. Based on the calculations from above, provide a summary of findings. a. Are there any trends discovered from the horizontal analysis? What do these trends imply about the business operations for Walmart. b. Identify the significant change from the vertical analysis. What does the change imply on business operations and what are the economic reasons that lead to the change? c. From the ratio analysis, interpret the trend of the ratio change as good and bad and the implication on business operations. 6. Based on the financial performance, indicate if the company is worthwhile for a long-term investment. Consolidated Statements of Inc Balance Sheet Ratio Analysis Cash Flow Statements Consolidated Statements of Inc Balance Sheet Ratio Analysis Cash Flow Statements Walmart Inc. Consolidated Statements of Cash Flows 2. Apply horizontal (growth rate) analysis over the last year's number for important items in the shaded area on the Income Statement and the Balance Sheet. 3. For vertical analysis, construct the common-size income statement and common-size balance sheet by expressing each item in the shaded area on the Income Statement and the Balance Sheet as a percentage of a relevant total within the same year. 4. In the ratio analysis sheet, calculate financial ratios for the latest 5 years. The ratios are grouped into four categories: a. Profitability Ratios: Gross Margin, Profit Margin, ROA, ROE b. Liquidity and Efficiency Ratios: Current Ratio, Quick Ratio, A/R turnover, Inventory turnover, Total Assets Turnover c. Solvency Ratios: Debt to Equity Ratio, Times Interest Earned d. Market Oriented Ratios: Price-Earnings Ratio, Dividend Yield 5. Based on the calculations from above, provide a summary of findings. a. Are there any trends discovered from the horizontal analysis? What do these trends imply about the business operations for Walmart. b. Identify the significant change from the vertical analysis. What does the change imply on business operations and what are the economic reasons that lead to the change? c. From the ratio analysis, interpret the trend of the ratio change as good and bad and the implication on business operations. 6. Based on the financial performance, indicate if the company is worthwhile for a long-term investment. Consolidated Statements of Inc Balance Sheet Ratio Analysis Cash Flow Statements Consolidated Statements of Inc Balance Sheet Ratio Analysis Cash Flow Statements Walmart Inc. Consolidated Statements of Cash Flows


