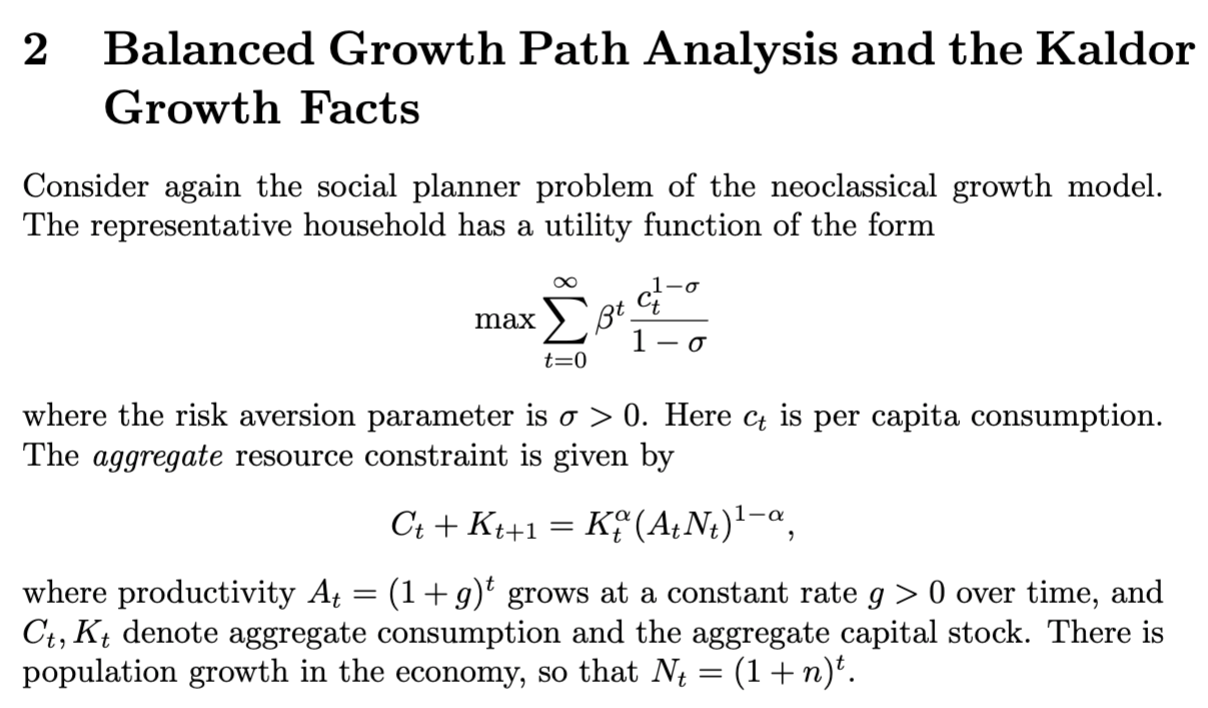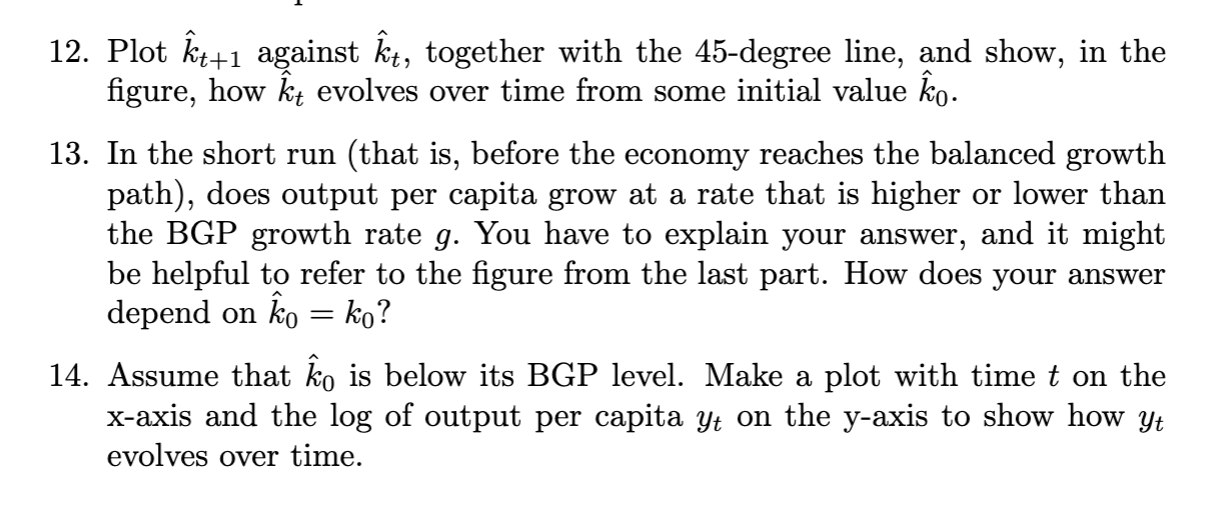


2 Balanced Growth Path Analysis and the Kaldor Growth Facts Consider again the social planner problem of the neoclassical growth model. The representative household has a utility function of the form maxt=0t1ct1 where the risk aversion parameter is >0. Here ct is per capita consumption. The aggregate resource constraint is given by Ct+Kt+1=Kt(AtNt)1, where productivity At=(1+g)t grows at a constant rate g>0 over time, and Ct,Kt denote aggregate consumption and the aggregate capital stock. There is population growth in the economy, so that Nt=(1+n)t. Define productivity-deflated consumption and capital as c^tk^t=(1+g)tct=(1+g)tkt 12. Plot k^t+1 against k^t, together with the 45 -degree line, and show, in the figure, how k^t evolves over time from some initial value k^0. 13. In the short run (that is, before the economy reaches the balanced growth path), does output per capita grow at a rate that is higher or lower than the BGP growth rate g. You have to explain your answer, and it might be helpful to refer to the figure from the last part. How does your answer depend on k^0=k0 ? 14. Assume that k^0 is below its BGP level. Make a plot with time t on the x-axis and the log of output per capita yt on the y-axis to show how yt evolves over time. 2 Balanced Growth Path Analysis and the Kaldor Growth Facts Consider again the social planner problem of the neoclassical growth model. The representative household has a utility function of the form maxt=0t1ct1 where the risk aversion parameter is >0. Here ct is per capita consumption. The aggregate resource constraint is given by Ct+Kt+1=Kt(AtNt)1, where productivity At=(1+g)t grows at a constant rate g>0 over time, and Ct,Kt denote aggregate consumption and the aggregate capital stock. There is population growth in the economy, so that Nt=(1+n)t. Define productivity-deflated consumption and capital as c^tk^t=(1+g)tct=(1+g)tkt 12. Plot k^t+1 against k^t, together with the 45 -degree line, and show, in the figure, how k^t evolves over time from some initial value k^0. 13. In the short run (that is, before the economy reaches the balanced growth path), does output per capita grow at a rate that is higher or lower than the BGP growth rate g. You have to explain your answer, and it might be helpful to refer to the figure from the last part. How does your answer depend on k^0=k0 ? 14. Assume that k^0 is below its BGP level. Make a plot with time t on the x-axis and the log of output per capita yt on the y-axis to show how yt evolves over time


