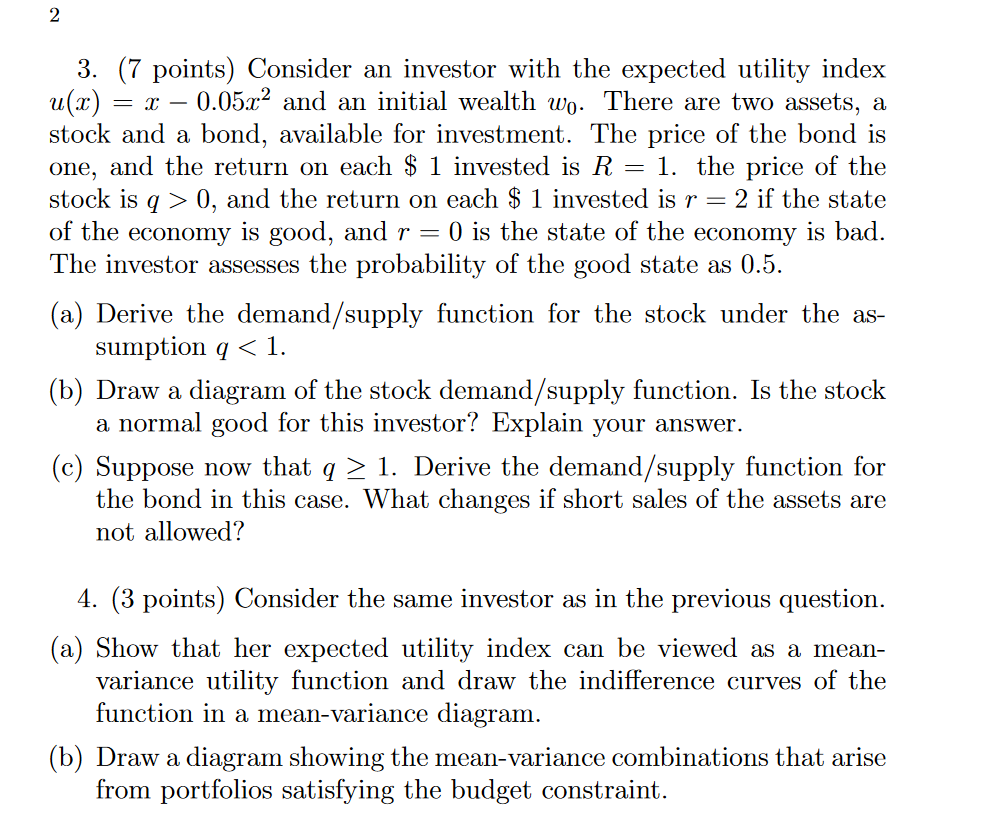
2 = C- 3. (7 points) Consider an investor with the expected utility index u(.r) 0.05x2 and an initial wealth wo. There are two assets, a stock and a bond, available for investment. The price of the bond is one, and the return on each $ 1 invested is R = 1. the price of the stock is q> 0, and the return on each $ 1 invested is r = 2 if the state of the economy is good, and r = 0 is the state of the economy is bad. The investor assesses the probability of the good state as 0.5. (a) Derive the demand/supply function for the stock under the as- sumption q 1. Derive the demand/supply function for the bond in this case. What changes if short sales of the assets are not allowed? 4. (3 points) Consider the same investor as in the previous question. (a) Show that her expected utility index can be viewed as a mean- variance utility function and draw the indifference curves of the function in a mean-variance diagram. (b) Draw a diagram showing the mean-variance combinations that arise from portfolios satisfying the budget constraint. 2 = C- 3. (7 points) Consider an investor with the expected utility index u(.r) 0.05x2 and an initial wealth wo. There are two assets, a stock and a bond, available for investment. The price of the bond is one, and the return on each $ 1 invested is R = 1. the price of the stock is q> 0, and the return on each $ 1 invested is r = 2 if the state of the economy is good, and r = 0 is the state of the economy is bad. The investor assesses the probability of the good state as 0.5. (a) Derive the demand/supply function for the stock under the as- sumption q 1. Derive the demand/supply function for the bond in this case. What changes if short sales of the assets are not allowed? 4. (3 points) Consider the same investor as in the previous question. (a) Show that her expected utility index can be viewed as a mean- variance utility function and draw the indifference curves of the function in a mean-variance diagram. (b) Draw a diagram showing the mean-variance combinations that arise from portfolios satisfying the budget constraint


