2. Common size statement analysis (5 points)
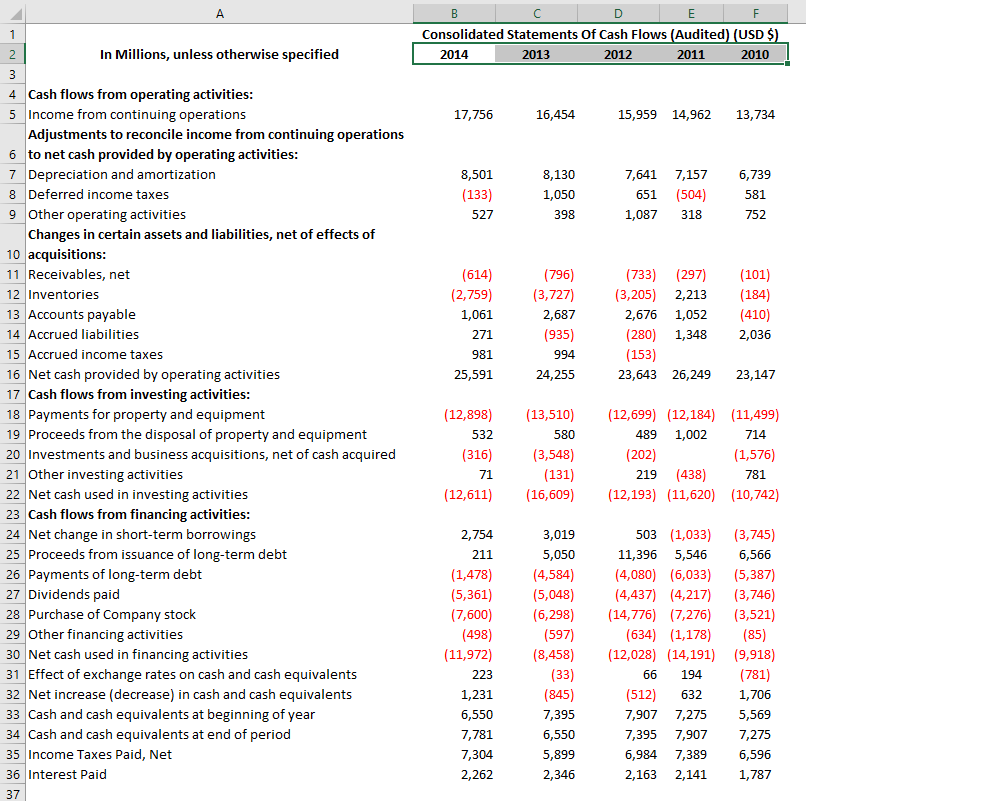
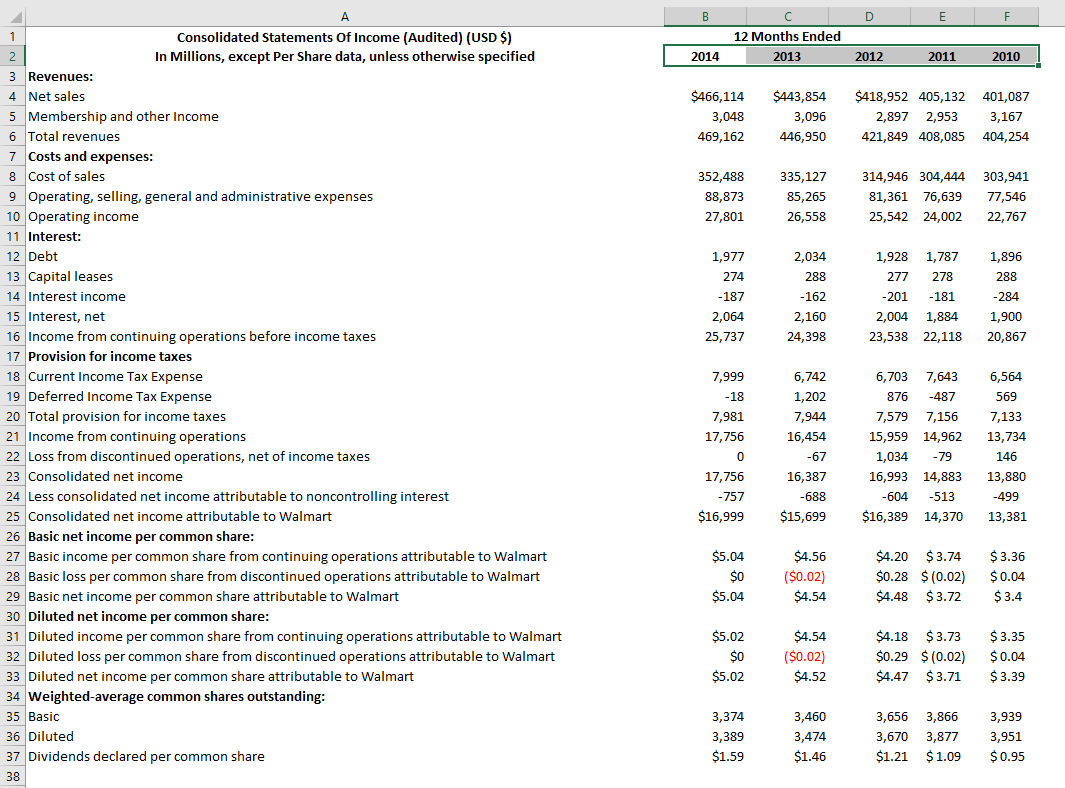
a. Prepare a common size cash flow statement using net sales as the common size and keep 2 decimal places in the percentage, (for example, 12.43%).
b. Are depreciation expenses and capital expenditure significant components in the cash flow statement percentagewise? Is that surprising?
c. Percentagewise, is operating cash flowet sales higher than net income/sales?? Is that good?
d. Do operating cash flows meet the needs of investment and distribution? Provide your comment(s) on the trend of the answer to this question?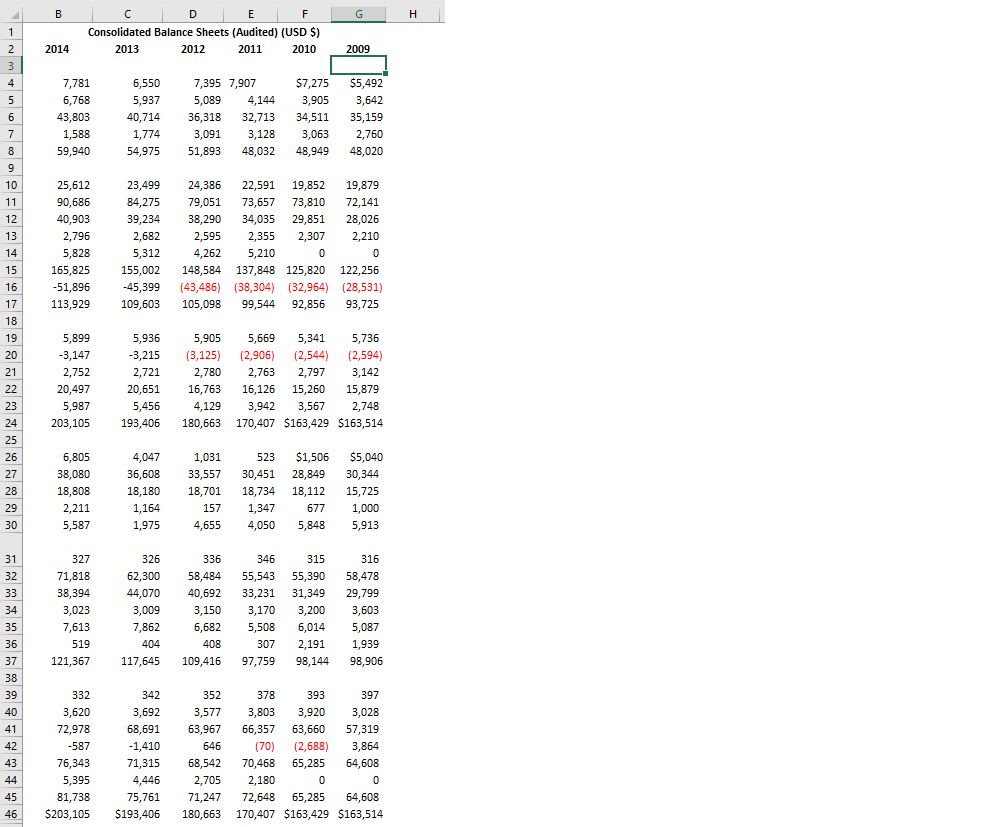
B G H 1 2 2 3 3 E F Consolidated Balance Sheets (Audited) (USD $) 2013 2012 2011 2010 2014 2009 4 5 6 7 7,781 6,768 43,803 1,588 59,940 6,550 5,937 40,714 1,774 54,975 7,395 7,907 5,089 4,144 36,318 32,713 3,091 3,128 51,893 48,032 $7,275 3,905 34,511 3,063 48,949 $5,492 3,642 35,159 2,760 48,020 8 9 10 11 12 13 14 25,612 90,686 40,903 2,796 5,828 165,825 -51,896 113,929 23,499 84,275 39,234 2,682 5,312 155,002 -45,399 109,603 24,386 22,591 19,852 19,879 79,051 73,657 73,810 72,141 38,290 34,035 29,851 28,026 2,595 2,355 2,307 2,210 4,262 5,210 0 0 148,584 137,848 125,820 122,256 (43,486) (38,304) (32,964) (28,531) 105,098 99,544 92,856 93,725 15 16 17 18 19 20 21 22 23 24 25 26 27 28 29 30 5,899 -3,147 2,752 20,497 5,987 203,105 5,936 -3,215 2,721 20,651 5,456 193,406 5,905 (3,125) 2,780 16,763 4,129 180,663 5,669 5,341 5,736 (2,906) (2,544) (2,594) 2,763 2,797 3,142 16,126 15,260 15,879 3,942 3,567 2,748 170,407 $163,429 $163,514 1,031 33,557 6,805 38,080 18,808 2,211 5,587 4,047 36,608 18,180 1,164 1,975 523 30,451 18,734 1,347 4,050 18,701 157 4,655 $1,506 28,849 18,112 677 5,848 $5,040 30,344 15,725 1,000 5,913 336 31 32 33 34 35 36 37 38 39 40 41 327 71,818 38,394 3,023 7,613 519 121,367 326 62,300 44,070 3,009 7,862 404 117,645 58,484 40,692 3,150 6,682 408 109,416 346 55,543 33,231 3,170 5,508 307 97,759 315 55,390 31,349 3,200 6,014 2,191 98,144 316 58,478 29,799 3,603 5,087 1,939 98,906 42 43 44 45 46 332 3,620 72,978 -587 76,343 5,395 81,738 $203, 105 342 3,692 68,691 -1,410 71,315 4,446 75,761 $193,406 352 3,577 63,967 646 68,542 2,705 71,247 180,663 378 393 397 3,803 3,920 3,028 66,357 63,660 57,319 (70) (2,688 3,864 70,468 65,285 64,608 2,180 0 0 72,648 65,285 64,608 170,407 $163,429 $163,514 A B D Consolidated Statements of Cash Flows (Audited) (USD $) 2014 2013 2012 2011 2010 17,756 16,454 15,959 14,962 13,734 8,501 (133) 527 8,130 1,050 398 7,641 651 1,087 7,157 (504) 318 6,739 581 752 (614) (2,759) 1,061 271 981 25,591 (796) (3,727) 2,687 (935) 994 24,255 (733) (297) (3,205) 2,213 2,676 1,052 1,348 (153) 23,643 26,249 (101) (184) (410) 2,036 (280) 23,147 1 2 In Millions, unless otherwise specified 3 4 Cash flows from operating activities: 5 Income from continuing operations Adjustments to reconcile income from continuing operations 6 to net cash provided by operating activities: 7 Depreciation and amortization 8 Deferred income taxes 9 Other operating activities Changes in certain assets and liabilities, net of effects of 10 acquisitions: 11 Receivables, net 12 Inventories 13 Accounts payable 14 Accrued liabilities 15 Accrued income taxes 16 Net cash provided by operating activities 17 Cash flows from investing activities: 18 Payments for property and equipment 19 Proceeds from the disposal of property and equipment 20 Investments and business acquisitions, net of cash acquired 21 Other investing activities 22 Net cash used in investing activities 23 Cash flows from financing activities: 24 Net change in short-term borrowings 25 Proceeds from issuance of long-term debt 26 Payments of long-term debt 27 Dividends paid 28 Purchase of Company stock 29 Other financing activities 30 Net cash used in financing activities 31 Effect of exchange rates on cash and cash equivalents 32 Net increase (decrease) in cash and cash equivalents 33 Cash and cash equivalents at beginning of year 34 Cash and cash equivalents at end of period 35 Income Taxes Paid, Net 36 Interest Paid 37 (12,898) 532 (316) 71 (12,611) (13,510) 580 (3,548) (131) (16,609) (12,699) (12,184) (11,499) 489 1,002 714 (202) (1,576) 219 (438) 781 (12,193) (11,620) (10,742) 2,754 211 (1,478) (5,361) (7,600) (498) (11,972) 223 1,231 6,550 7,781 7,304 2,262 3,019 5,050 (4,584) (5,048) (6,298) (597) (8,458) (33) (845) 7,395 6,550 5,899 2,346 503 (1,033) (3,745) 11,396 5,546 6,566 (4,080) (6,033) (5,387) (4,437) (4,217) (3,746) (14,776) (7,276) (3,521) (634) (1,178) (85) (12,028) (14,191) (9,918) 66 194 (781) (512) 632 1,706 7,907 7,275 5,569 7,395 7,907 7,275 6,984 7,389 6,596 2,163 2,141 1,787 B E F 12 Months Ended 2013 2014 2012 2011 2010 4 $466,114 3,048 469,162 $443,854 3,096 446,950 $418,952 405,132 2,897 2,953 421,849 408,085 401,087 3,167 404,254 352,488 88,873 27,801 335,127 85,265 26,558 314,946 304,444 81,361 76,639 25,542 24,002 303,941 77,546 22,767 1,977 274 -187 2,034 288 -162 2,160 24,398 1,928 1,787 277 278 -201 -181 2,004 1,884 23,538 22,118 1,896 288 -284 1,900 20,867 2,064 25,737 6,742 6,703 1 Consolidated Statements of Income (Audited) (USD $) 2 In Millions, except Per Share data, unless otherwise specified 3 Revenues: Net sales 5 Membership and other Income 6 Total revenues 7 Costs and expenses: 8 Cost of sales 9 Operating, selling, general and administrative expenses 10 Operating income 11 Interest: 12 Debt 13 Capital leases 14 Interest income 15 Interest, net 16 Income from continuing operations before income taxes 17 Provision for income taxes 18 Current Income Tax Expense 19 Deferred Income Tax Expense 20 Total provision for income taxes 21 Income from continuing operations 22 Loss from discontinued operations, net of income taxes 23 Consolidated net income 24 Less consolidated net income attributable to noncontrolling interest 25 Consolidated net income attributable to Walmart 26 Basic net income per common share: 27 Basic income per common share from continuing operations attributable to Walmart 28 Basic loss per common share from discontinued operations attributable to Walmart 29 Basic net income per common share attributable to Walmart 30 Diluted net income per common share: 31 Diluted income per common share from continuing operations attributable to Walmart 32 Diluted loss per common share from discontinued operations attributable to Walmart 33 Diluted net income per common share attributable to Walmart 34 Weighted average common shares outstanding: 35 Basic 36 Diluted 37 Dividends declared per common share 38 7,999 -18 7,981 17,756 0 17,756 -757 $16,999 1,202 7,944 16,454 -67 16,387 -688 $15,699 7,643 876 -487 7,579 7,156 15,959 14,962 1,034 -79 16,993 14,883 -604 -513 $16,389 14,370 6,564 569 7,133 13,734 146 13,880 -499 13,381 $5.04 $0 $5.04 $4.56 ($0.02) $4.54 $4.20 $ 3.74 $0.28 $ (0.02) $4.48 $ 3.72 $3.36 $ 0.04 $ 3.4 $5.02 $0 $5.02 $4.54 ($0.02) $4.52 $4.18 $ 3.73 $0.29 $ (0.02) $4.47 $ 3.71 $ 3.35 $ 0.04 $3.39 3,374 3,389 $1.59 3,460 3,474 $1.46 3,656 3,670 $1.21 3,866 3,877 $ 1.09 3,939 3,951 $0.95 B G H 1 2 2 3 3 E F Consolidated Balance Sheets (Audited) (USD $) 2013 2012 2011 2010 2014 2009 4 5 6 7 7,781 6,768 43,803 1,588 59,940 6,550 5,937 40,714 1,774 54,975 7,395 7,907 5,089 4,144 36,318 32,713 3,091 3,128 51,893 48,032 $7,275 3,905 34,511 3,063 48,949 $5,492 3,642 35,159 2,760 48,020 8 9 10 11 12 13 14 25,612 90,686 40,903 2,796 5,828 165,825 -51,896 113,929 23,499 84,275 39,234 2,682 5,312 155,002 -45,399 109,603 24,386 22,591 19,852 19,879 79,051 73,657 73,810 72,141 38,290 34,035 29,851 28,026 2,595 2,355 2,307 2,210 4,262 5,210 0 0 148,584 137,848 125,820 122,256 (43,486) (38,304) (32,964) (28,531) 105,098 99,544 92,856 93,725 15 16 17 18 19 20 21 22 23 24 25 26 27 28 29 30 5,899 -3,147 2,752 20,497 5,987 203,105 5,936 -3,215 2,721 20,651 5,456 193,406 5,905 (3,125) 2,780 16,763 4,129 180,663 5,669 5,341 5,736 (2,906) (2,544) (2,594) 2,763 2,797 3,142 16,126 15,260 15,879 3,942 3,567 2,748 170,407 $163,429 $163,514 1,031 33,557 6,805 38,080 18,808 2,211 5,587 4,047 36,608 18,180 1,164 1,975 523 30,451 18,734 1,347 4,050 18,701 157 4,655 $1,506 28,849 18,112 677 5,848 $5,040 30,344 15,725 1,000 5,913 336 31 32 33 34 35 36 37 38 39 40 41 327 71,818 38,394 3,023 7,613 519 121,367 326 62,300 44,070 3,009 7,862 404 117,645 58,484 40,692 3,150 6,682 408 109,416 346 55,543 33,231 3,170 5,508 307 97,759 315 55,390 31,349 3,200 6,014 2,191 98,144 316 58,478 29,799 3,603 5,087 1,939 98,906 42 43 44 45 46 332 3,620 72,978 -587 76,343 5,395 81,738 $203, 105 342 3,692 68,691 -1,410 71,315 4,446 75,761 $193,406 352 3,577 63,967 646 68,542 2,705 71,247 180,663 378 393 397 3,803 3,920 3,028 66,357 63,660 57,319 (70) (2,688 3,864 70,468 65,285 64,608 2,180 0 0 72,648 65,285 64,608 170,407 $163,429 $163,514 A B D Consolidated Statements of Cash Flows (Audited) (USD $) 2014 2013 2012 2011 2010 17,756 16,454 15,959 14,962 13,734 8,501 (133) 527 8,130 1,050 398 7,641 651 1,087 7,157 (504) 318 6,739 581 752 (614) (2,759) 1,061 271 981 25,591 (796) (3,727) 2,687 (935) 994 24,255 (733) (297) (3,205) 2,213 2,676 1,052 1,348 (153) 23,643 26,249 (101) (184) (410) 2,036 (280) 23,147 1 2 In Millions, unless otherwise specified 3 4 Cash flows from operating activities: 5 Income from continuing operations Adjustments to reconcile income from continuing operations 6 to net cash provided by operating activities: 7 Depreciation and amortization 8 Deferred income taxes 9 Other operating activities Changes in certain assets and liabilities, net of effects of 10 acquisitions: 11 Receivables, net 12 Inventories 13 Accounts payable 14 Accrued liabilities 15 Accrued income taxes 16 Net cash provided by operating activities 17 Cash flows from investing activities: 18 Payments for property and equipment 19 Proceeds from the disposal of property and equipment 20 Investments and business acquisitions, net of cash acquired 21 Other investing activities 22 Net cash used in investing activities 23 Cash flows from financing activities: 24 Net change in short-term borrowings 25 Proceeds from issuance of long-term debt 26 Payments of long-term debt 27 Dividends paid 28 Purchase of Company stock 29 Other financing activities 30 Net cash used in financing activities 31 Effect of exchange rates on cash and cash equivalents 32 Net increase (decrease) in cash and cash equivalents 33 Cash and cash equivalents at beginning of year 34 Cash and cash equivalents at end of period 35 Income Taxes Paid, Net 36 Interest Paid 37 (12,898) 532 (316) 71 (12,611) (13,510) 580 (3,548) (131) (16,609) (12,699) (12,184) (11,499) 489 1,002 714 (202) (1,576) 219 (438) 781 (12,193) (11,620) (10,742) 2,754 211 (1,478) (5,361) (7,600) (498) (11,972) 223 1,231 6,550 7,781 7,304 2,262 3,019 5,050 (4,584) (5,048) (6,298) (597) (8,458) (33) (845) 7,395 6,550 5,899 2,346 503 (1,033) (3,745) 11,396 5,546 6,566 (4,080) (6,033) (5,387) (4,437) (4,217) (3,746) (14,776) (7,276) (3,521) (634) (1,178) (85) (12,028) (14,191) (9,918) 66 194 (781) (512) 632 1,706 7,907 7,275 5,569 7,395 7,907 7,275 6,984 7,389 6,596 2,163 2,141 1,787 B E F 12 Months Ended 2013 2014 2012 2011 2010 4 $466,114 3,048 469,162 $443,854 3,096 446,950 $418,952 405,132 2,897 2,953 421,849 408,085 401,087 3,167 404,254 352,488 88,873 27,801 335,127 85,265 26,558 314,946 304,444 81,361 76,639 25,542 24,002 303,941 77,546 22,767 1,977 274 -187 2,034 288 -162 2,160 24,398 1,928 1,787 277 278 -201 -181 2,004 1,884 23,538 22,118 1,896 288 -284 1,900 20,867 2,064 25,737 6,742 6,703 1 Consolidated Statements of Income (Audited) (USD $) 2 In Millions, except Per Share data, unless otherwise specified 3 Revenues: Net sales 5 Membership and other Income 6 Total revenues 7 Costs and expenses: 8 Cost of sales 9 Operating, selling, general and administrative expenses 10 Operating income 11 Interest: 12 Debt 13 Capital leases 14 Interest income 15 Interest, net 16 Income from continuing operations before income taxes 17 Provision for income taxes 18 Current Income Tax Expense 19 Deferred Income Tax Expense 20 Total provision for income taxes 21 Income from continuing operations 22 Loss from discontinued operations, net of income taxes 23 Consolidated net income 24 Less consolidated net income attributable to noncontrolling interest 25 Consolidated net income attributable to Walmart 26 Basic net income per common share: 27 Basic income per common share from continuing operations attributable to Walmart 28 Basic loss per common share from discontinued operations attributable to Walmart 29 Basic net income per common share attributable to Walmart 30 Diluted net income per common share: 31 Diluted income per common share from continuing operations attributable to Walmart 32 Diluted loss per common share from discontinued operations attributable to Walmart 33 Diluted net income per common share attributable to Walmart 34 Weighted average common shares outstanding: 35 Basic 36 Diluted 37 Dividends declared per common share 38 7,999 -18 7,981 17,756 0 17,756 -757 $16,999 1,202 7,944 16,454 -67 16,387 -688 $15,699 7,643 876 -487 7,579 7,156 15,959 14,962 1,034 -79 16,993 14,883 -604 -513 $16,389 14,370 6,564 569 7,133 13,734 146 13,880 -499 13,381 $5.04 $0 $5.04 $4.56 ($0.02) $4.54 $4.20 $ 3.74 $0.28 $ (0.02) $4.48 $ 3.72 $3.36 $ 0.04 $ 3.4 $5.02 $0 $5.02 $4.54 ($0.02) $4.52 $4.18 $ 3.73 $0.29 $ (0.02) $4.47 $ 3.71 $ 3.35 $ 0.04 $3.39 3,374 3,389 $1.59 3,460 3,474 $1.46 3,656 3,670 $1.21 3,866 3,877 $ 1.09 3,939 3,951 $0.95