

Question
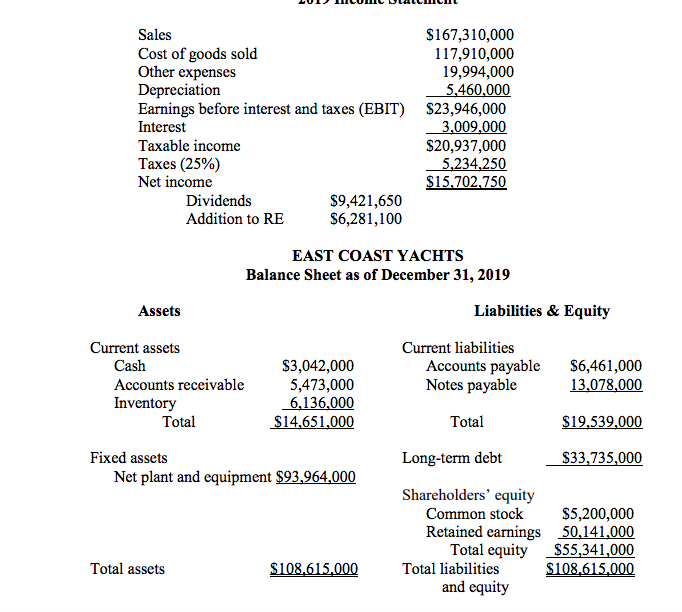
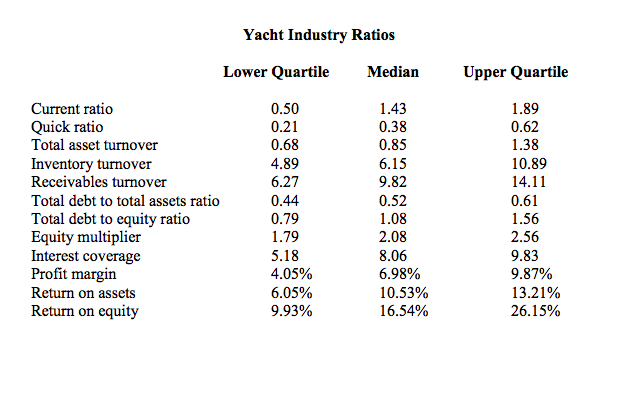
2. Compare the financial ratios of East Coast Yachts to the industry as a whole by the following categories. a) Short-term solvency or liquidity measures
2. Compare the financial ratios of East Coast Yachts to the industry as a whole by the following categories. a) Short-term solvency or liquidity measures b) Long-term solvency measures c) Asset management or turnover measures d) Profitability measures
Also comment on the performance of each category (a) to (d) above and overall performance of East Coast Yachts based on your analyses.
3) Calculate the sustainable growth rate of East Coast Yachts. Prepare pro forma income statement and balance sheet. Assume that sales, cost of goods sold, other expenses, current assets (cash, accounts receivable, and inventory), fixed assets, and current liabilities (accounts payable and notes payable) grow at precisely this rate. Also assume that depreciation, interest, long-term debt, and common stock remain the same. The firms tax rate is 25%. Compute external fund needed (EFN). (Note that the total equity used to compute the return on equity (ROE) is taken from an ending balance sheet. When you compute the sustainable growth rate, you need to use the following formula: Sustainable growth rate = ROExb 1(ROExb) , where b is the retention or plowback ratio.)
Step by Step Solution
There are 3 Steps involved in it
Step: 1

Get Instant Access to Expert-Tailored Solutions
See step-by-step solutions with expert insights and AI powered tools for academic success
Step: 2

Step: 3
Ace Your Homework with AI
Get the answers you need in no time with our AI-driven, step-by-step assistance
Get Started
New Horizons In The Field Of Management Audit As A Tool For Improving The Overall Management Of Enterprises A Guideline For Good Governance
Authors: Mohammed Sakhawat Hossain
1st Edition
3639194454, 978-3639194456