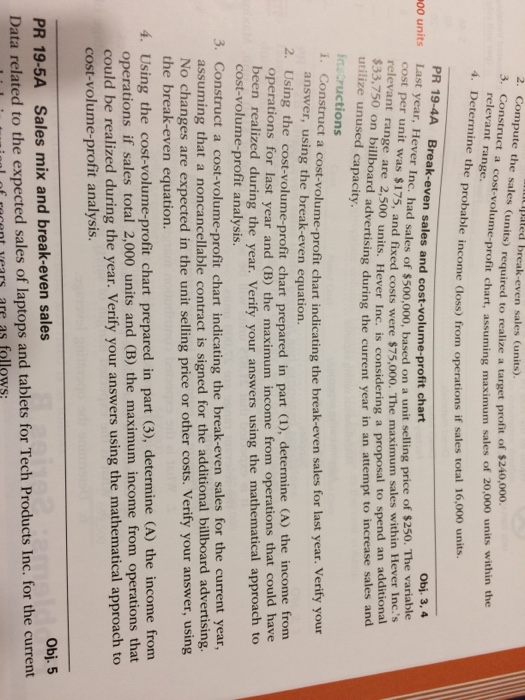
2. Compute th e sales (units) required to realize a target profit of s Construct a cost-volu relevant range. he-profit chart, assuming maximum sales of 20,000 units within the Determine the probable income loss) from operations if sales total 1o PR 19-4A 00 units Last year, Hever Inc. Break-even sales and cost-volume-profit chart Obj. 3, 4 nc.had sales of $500.000, based on a unit selling price of $250. The variable 7S, and fixed costs were $75,000. The maximum sales within Hever Inc cost per unit was $175 ge 2,500 units. Hever Inc. is considering a proposal to spend an additional $33,750 on billboard advertising during the current year utilize unused capacity iatructions i. C in an attempt to increase sales and onstruct a cost-volume-profit chart indicating the break-even sales for last year. Verify your answer, using the break-even equation 2. Using the cost-volume-profit chart prepared in part (1), determine the income from operations for last year and (B) the maximum income from operations that could have been realized during the year. Verify your answers using the mathematical approach to cost-volume-profit analysis. Construct a cost-volume-profit chart indicating the break-even sales for the current year, assuming that a noncancellable contract is signed for the additional billboard advertising No changes are expected in the unit selling price or other costs. Verify your answer, using the break-even equation. operations if sales total 2,000 units and (B) the maximum income from operations that could be realized during the year. Verify your answers using the mathematical approach to 2 Using the cost-volume-profit chart prepared in part (3), determine (A) the income from cost-volume-profit analysis Obj. 5 PR 19-5A Sales mix and break-even sales Data related to the expected sales of laptops and tablets for Tech Products Inc. for the currernt