Question
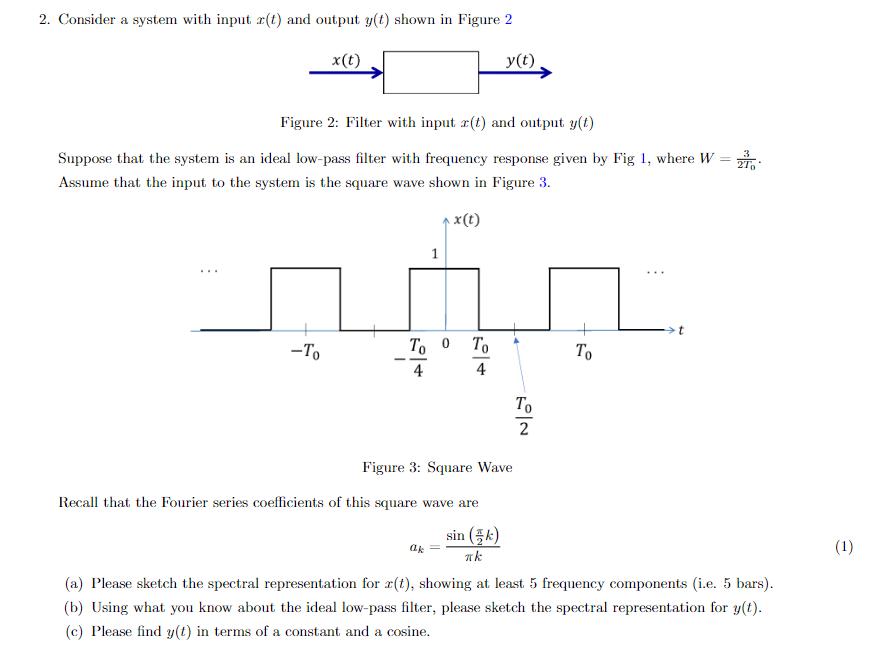
2. Consider a system with input (t) and output y(t) shown in Figure 2 x(t) y(t) Figure 2: Filter with input (t) and output

2. Consider a system with input (t) and output y(t) shown in Figure 2 x(t) y(t) Figure 2: Filter with input (t) and output y(t) Suppose that the system is an ideal low-pass filter with frequency response given by Fig 1, where W = 20 Assume that the input to the system is the square wave shown in Figure 3. 1 x(t) -To - To 0 - 4 64 To 5/2 Figure 3: Square Wave Recall that the Fourier series coefficients of this square wave are sin () k To t (a) Please sketch the spectral representation for x(t), showing at least 5 frequency components (i.e. 5 bars). (b) Using what you know about the ideal low-pass filter, please sketch the spectral representation for y(t). (c) Please find y(t) in terms of a constant and a cosine. (1)
Step by Step Solution
There are 3 Steps involved in it
Step: 1

Get Instant Access to Expert-Tailored Solutions
See step-by-step solutions with expert insights and AI powered tools for academic success
Step: 2

Step: 3

Ace Your Homework with AI
Get the answers you need in no time with our AI-driven, step-by-step assistance
Get StartedRecommended Textbook for
Signals and Systems using MATLAB
Authors: Luis Chaparro
2nd edition
123948126, 978-0123948120
Students also viewed these Programming questions
Question
Answered: 1 week ago
Question
Answered: 1 week ago
Question
Answered: 1 week ago
Question
Answered: 1 week ago
Question
Answered: 1 week ago
Question
Answered: 1 week ago
Question
Answered: 1 week ago
Question
Answered: 1 week ago
Question
Answered: 1 week ago
Question
Answered: 1 week ago
Question
Answered: 1 week ago
Question
Answered: 1 week ago
Question
Answered: 1 week ago
Question
Answered: 1 week ago
Question
Answered: 1 week ago
Question
Answered: 1 week ago
Question
Answered: 1 week ago
Question
Answered: 1 week ago
Question
Answered: 1 week ago
Question
Answered: 1 week ago
Question
Answered: 1 week ago
Question
Answered: 1 week ago
Question
Answered: 1 week ago
View Answer in SolutionInn App


