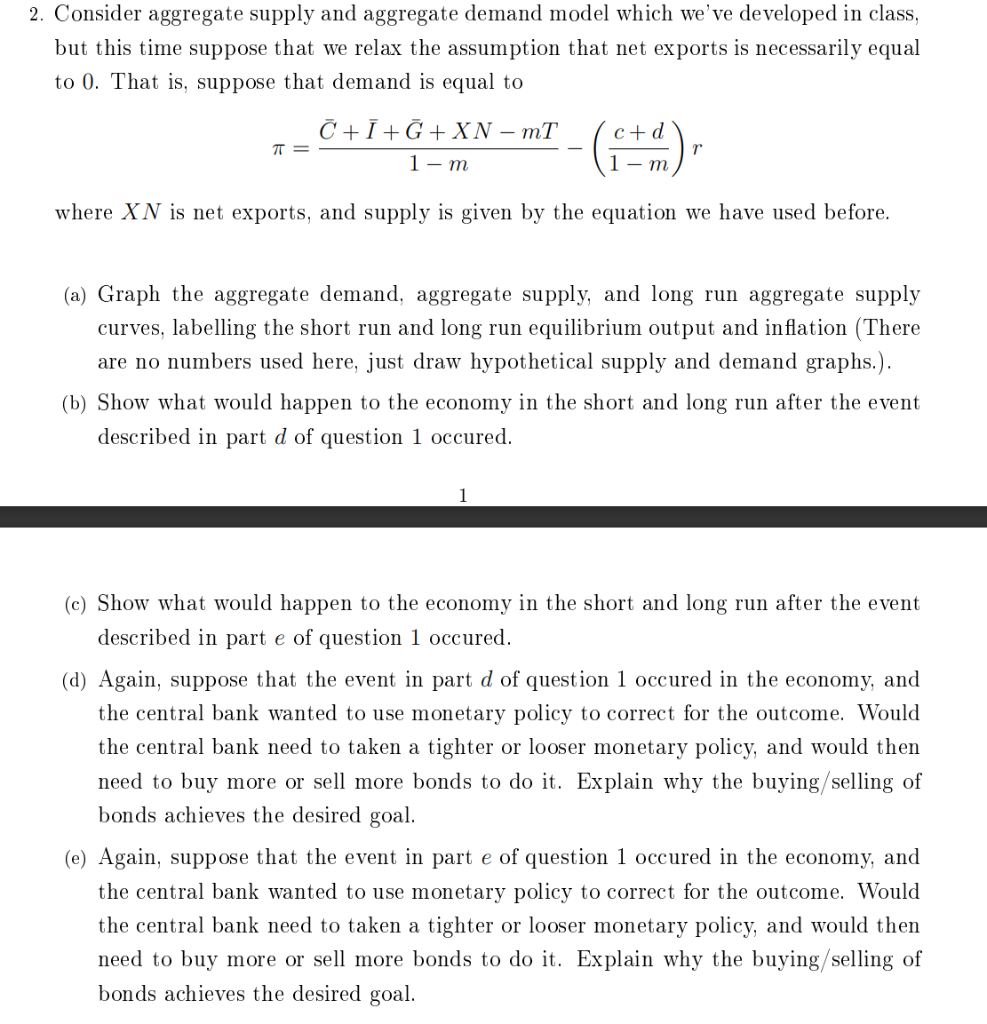
2. Consider aggregate supply and aggregate demand model which we've developed in class, but this time suppose that we relax the assumption that net exports is necessarily equal to 0 . That is, suppose that demand is equal to =1mC+I+G+XNmT(1mc+d)r where XN is net exports, and supply is given by the equation we have used before. (a) Graph the aggregate demand, aggregate supply, and long run aggregate supply curves, labelling the short run and long run equilibrium output and inflation (There are no numbers used here, just draw hypothetical supply and demand graphs.). (b) Show what would happen to the economy in the short and long run after the event described in part d of question 1 occured. 1 (c) Show what would happen to the economy in the short and long run after the event described in part e of question 1 occured. (d) Again, suppose that the event in part d of question 1 occured in the economy, and the central bank wanted to use monetary policy to correct for the outcome. Would the central bank need to taken a tighter or looser monetary policy, and would then need to buy more or sell more bonds to do it. Explain why the buying/selling of bonds achieves the desired goal. (e) Again, suppose that the event in part e of question 1 occured in the economy, and the central bank wanted to use monetary policy to correct for the outcome. Would the central bank need to taken a tighter or looser monetary policy, and would then need to buy more or sell more bonds to do it. Explain why the buying/selling of bonds achieves the desired goal. 2. Consider aggregate supply and aggregate demand model which we've developed in class, but this time suppose that we relax the assumption that net exports is necessarily equal to 0 . That is, suppose that demand is equal to =1mC+I+G+XNmT(1mc+d)r where XN is net exports, and supply is given by the equation we have used before. (a) Graph the aggregate demand, aggregate supply, and long run aggregate supply curves, labelling the short run and long run equilibrium output and inflation (There are no numbers used here, just draw hypothetical supply and demand graphs.). (b) Show what would happen to the economy in the short and long run after the event described in part d of question 1 occured. 1 (c) Show what would happen to the economy in the short and long run after the event described in part e of question 1 occured. (d) Again, suppose that the event in part d of question 1 occured in the economy, and the central bank wanted to use monetary policy to correct for the outcome. Would the central bank need to taken a tighter or looser monetary policy, and would then need to buy more or sell more bonds to do it. Explain why the buying/selling of bonds achieves the desired goal. (e) Again, suppose that the event in part e of question 1 occured in the economy, and the central bank wanted to use monetary policy to correct for the outcome. Would the central bank need to taken a tighter or looser monetary policy, and would then need to buy more or sell more bonds to do it. Explain why the buying/selling of bonds achieves the desired goal