Answered step by step
Verified Expert Solution
Question
1 Approved Answer
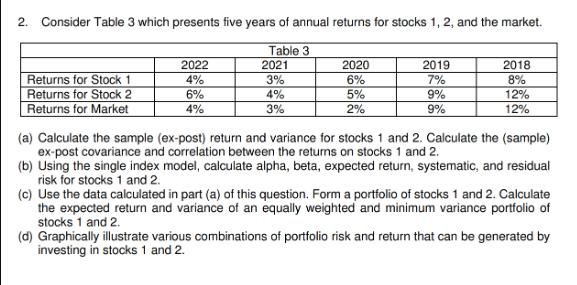
2. Consider Table 3 which presents five years of annual returns for stocks 1, 2, and the market. 2022 Table 3 2021 2020 2019

2. Consider Table 3 which presents five years of annual returns for stocks 1, 2, and the market. 2022 Table 3 2021 2020 2019 2018 Returns for Stock 1 4% 3% 6% 7% 8% Returns for Stock 2 6% 4% 5% 9% 12% Returns for Market 4% 3% 2% 9% 12% (a) Calculate the sample (ex-post) return and variance for stocks 1 and 2. Calculate the (sample) ex-post covariance and correlation between the returns on stocks 1 and 2. (b) Using the single index model, calculate alpha, beta, expected return, systematic, and residual risk for stocks 1 and 2. (c) Use the data calculated in part (a) of this question. Form a portfolio of stocks 1 and 2. Calculate the expected return and variance of an equally weighted and minimum variance portfolio of stocks 1 and 2. (d) Graphically illustrate various combinations of portfolio risk and return that can be generated by investing in stocks 1 and 2.
Step by Step Solution
There are 3 Steps involved in it
Step: 1

Get Instant Access to Expert-Tailored Solutions
See step-by-step solutions with expert insights and AI powered tools for academic success
Step: 2

Step: 3

Ace Your Homework with AI
Get the answers you need in no time with our AI-driven, step-by-step assistance
Get Started


