

Question: 2. Consider the following data set consisting of four points: X1 = - [8], --[1].-= []. - [ ] Plot these points. We want to
![= - [8], --[1].-= []. - [ ] Plot these points. We](https://dsd5zvtm8ll6.cloudfront.net/si.experts.images/questions/2024/09/66f4641453643_43566f46413b85f6.jpg)
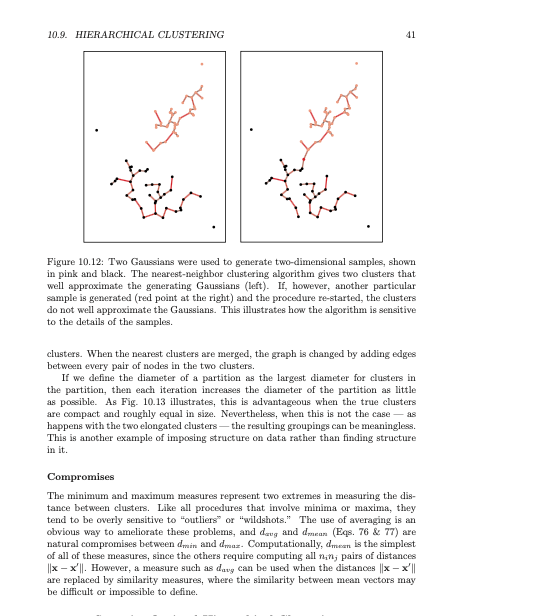
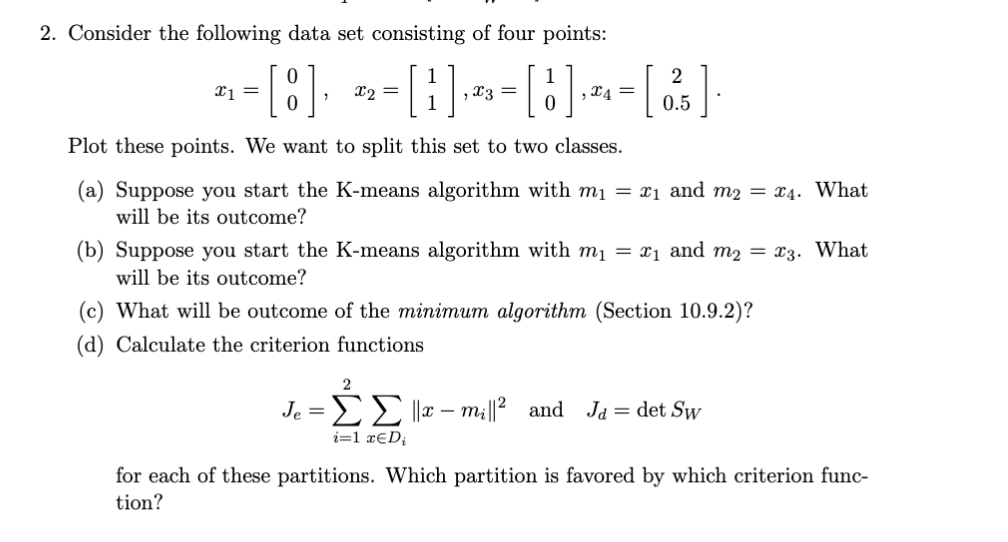
2. Consider the following data set consisting of four points: X1 = - [8], --[1].-= []. - [ ] Plot these points. We want to split this set to two classes. (a) Suppose you start the K-means algorithm with m = 21 and m2 = 24. What will be its outcome? (b) Suppose you start the K-means algorithm with m = x1 and m2 = x3. What will be its outcome? (c) What will be outcome of the minimum algorithm (Section 10.9.2)? (d) Calculate the criterion functions 2 Je = || 2 mil||2 and Ja = det Sw i=1 RED for each of these partitions. Which partition is favored by which criterion func- tion? 10.9.2 Agglomerative Hierarchical Clustering The major steps in agglomerative clustering are contained in the following procedure, where c is the desired number of final clusters: Algorithm 4 (Agglomerative hierarchical clustering) begin initialize ce-n,D; -- {xi}, i = 1,..., do 2-1 Find nearest clusters, say, D, and D, Merge D and D until c= return c clusters 7 end 8 3 4 5 As described, this procedure terminates when the specified number of clusters has been obtained and returns the clusters, described as set of points (rather than as mean or representative vectors). If we continue until c= 1 we can produce a dendrogram like that in Fig. 10.10. At any level the distance between nearest clusters can provide the dissimilarity value for that level. Note that we have not said how to the distance between two clusters, and hence how to find the "nearest" clusters, required by line 3 of the Algorithm. The considerations here are much like those involved in selecting a general clustering criterion function. For simplicity, we shall generally restrict our attention to the following distance measures: dmin (D.D) min ||x - x'|| Ke 2 dma (Di, D;) max x - x'|| (75) XED, ED 1 davy(D,D) = |x - x'|| (76) dmean(D., D) = mi-mill. (77) All of these measures have a minimum-variance flavor, and they usually yield the same results if the clusters are compact and well separated. However, if the clusters are close to one another, or if their shapes are not basically hyperspherical, quite different results can be obtained. Below we shall illustrate some of the differences But first let us consider the computational complexity of a particularly simple agglomerative clustering algorithm. Suppose we have n patterns in d-dimensional space, and we seek to form c clusters using dmin (D.,D;) defined in Eq. 74. We will, once and for all need to calculate nan 1) inter-point distances each of which is an 0(d) calculation and place the results in an inter-point distance table. The space complexity is, then, O(n). Finding the minimum distance pair (for the first merging) requires that we step through the complete list, keeping the 40 CHAPTER 10. UNSUPERVISED LEARNING AND CLUSTERING index of the smallest distance. Thus for the first agglomerative step, the complexity is O(n(n 1)(+1)) = O(n-X). For an arbitrary agglomeration step (i.e., from a to - 1), we need merely step through the nin - 1) - 2 "umused" distances in the list and find the smallest for which x and x' lie in different clusters. This is, again, O(n(n-1) - 2). The full time complexity is thus (and), and in typical conditions MINIMUM ALGORITHM SINGLE- LINKACE ALGORITHM SPANNING TREE The Nearest-Neighbor Algorithm When druin is used to measure the distance between clusters (Eq. 74) the algorithm is sometimes called the nearest-neighbor cluster algorithm, or minimum algorithm Moreover, if it is terminated when the distance between nearest clusters exceeds an arbitrary threshold, it is called the single-linkage algorithm. Suppose that we think of the data points as being nodes of a graph, with edges forming a path between the nodes in the same subset D. When druin is used to measure the distance between subsets, the nearest neighbor nodes determine the nearest subsets. The merging of D and D; corresponds to adding an edge between the nearest pair of nodes in D: and D. Since edges linking clusters always go between distinct clusters, the resulting graph never has any closed loops or circuits in the terminology of graph theory, this procedure generates a tree. If it is allowed to continue until all of the subsets are linked, the result is a spanning tree-a tree with a path from any node to any other node. Moreover, it can be shown that the sum of the edge lengths of the resulting tree will not exceed the sum of the edge lengths for any other spanning tree for that set of samples (Problem 37). Thus, with the use of dmin as the distance measure, the agglomerative clustering procedure becomes an algorithm for generating a minimal spanning tree. Figure 10.12 shows the results of applying this procedure to Gaussian data. In both cases the procedure was stopped giving two large clusters (plus three singleton outliers); a minimal spanning tree can be obtained by adding the shortest possible edge between the two clusters. In the first case where the clusters are fairly well separated, the obvious clusters are found. In the second case, the presence of a point located so as to produce a bridge between the clusters results in a rather unexpected grouping into one large, elongated cluster, and one small, compact cluster. This behavior is often called the chaining effect," and is sometimes considered to be a defect of this distance measure. To the extent that the results are very sensitive to noise or to slight changes in position of the data points, this is certainly a valid criticism. MAXIMUM ALGORITHM COMPLETE LINKAGE ALGORITHM The Farthest-Neighbor Algorithm When dmax (Eq. 75) is used to measure the distance between subsets, the algorithm is sometimes called the farthest-neighbor clustering algorithm, or marimum algorithm. If it is terminated when the distance between nearest clusters exceeds an arbitrary threshold, it is called the complete-linkage algorithm. The farthest-neighbor algorithm discourages the growth of elongated clusters. Application of the procedure can be thought of as producing a graph in which edges connect all of the nodes in a cluster. In the terminology of graph theory, every cluster constitutes a complete subgraph. The distance between two clusters is determined by the most distant nodes in the two There are methods for sorting or arranging the entries in the inter-point distance table so as to easily avoid inspection of points in the same cluster, but these typically do not improve the complexity results significantly COMPLETE SUBGRAPH 10.9. HIERARCHICAL CLUSTERING 41 Lama Figure 10.12: Two Gaussians were used to generate two-dimensional samples, shown in pink and black. The nearest-neighbor clustering algorithm gives two clusters that well approximate the generating Gaussians (left). If, however, another particular sample is generated (red point at the right) and the procedure re-started, the clusters do not well approximate the Gaussians. This illustrates how the algorithm is sensitive to the details of the samples. clusters. When the nearest clusters are merged, the graph is changed by adding edges between every pair of nodes in the two clusters. If we define the diameter of a partition as the largest diameter for clusters in the partition, then each iteration increases the diameter of the partition as little as possible. As Fig. 10.13 illustrates, this is advantageous when the true clusters are compact and roughly equal in size. Nevertheless, when this is not the case happens with the two elongated clusters - the resulting groupings can be meaningless. This is another example of imposing structure on data rather than finding structure in it. Compromises The minimum and maximum measures represent two extremes in measuring the dis- tance between clusters. Like all procedures that involve minima or maxima, they tend to be overly sensitive to "outliers" or "wildshots." The use of averaging is an obvious way to ameliorate these problems, and daug and dear (Eqs. 76 & 77) are natural compromises between druir and draz. Computationally, dmeen is the simplest of all of these measures, since the others require computing all ning pairs of distances ||X X'||. However, a measure such as davy can be used when the distances ||X X'||| are replaced by similarity measures, where the similarity between mean vectors may be difficult or impossible to define. 2. Consider the following data set consisting of four points: X1 = - [8], --[1].-= []. - [ ] Plot these points. We want to split this set to two classes. (a) Suppose you start the K-means algorithm with m = 21 and m2 = 24. What will be its outcome? (b) Suppose you start the K-means algorithm with m = x1 and m2 = x3. What will be its outcome? (c) What will be outcome of the minimum algorithm (Section 10.9.2)? (d) Calculate the criterion functions 2 Je = || 2 mil||2 and Ja = det Sw i=1 RED for each of these partitions. Which partition is favored by which criterion func- tion? 10.9.2 Agglomerative Hierarchical Clustering The major steps in agglomerative clustering are contained in the following procedure, where c is the desired number of final clusters: Algorithm 4 (Agglomerative hierarchical clustering) begin initialize ce-n,D; -- {xi}, i = 1,..., do 2-1 Find nearest clusters, say, D, and D, Merge D and D until c= return c clusters 7 end 8 3 4 5 As described, this procedure terminates when the specified number of clusters has been obtained and returns the clusters, described as set of points (rather than as mean or representative vectors). If we continue until c= 1 we can produce a dendrogram like that in Fig. 10.10. At any level the distance between nearest clusters can provide the dissimilarity value for that level. Note that we have not said how to the distance between two clusters, and hence how to find the "nearest" clusters, required by line 3 of the Algorithm. The considerations here are much like those involved in selecting a general clustering criterion function. For simplicity, we shall generally restrict our attention to the following distance measures: dmin (D.D) min ||x - x'|| Ke 2 dma (Di, D;) max x - x'|| (75) XED, ED 1 davy(D,D) = |x - x'|| (76) dmean(D., D) = mi-mill. (77) All of these measures have a minimum-variance flavor, and they usually yield the same results if the clusters are compact and well separated. However, if the clusters are close to one another, or if their shapes are not basically hyperspherical, quite different results can be obtained. Below we shall illustrate some of the differences But first let us consider the computational complexity of a particularly simple agglomerative clustering algorithm. Suppose we have n patterns in d-dimensional space, and we seek to form c clusters using dmin (D.,D;) defined in Eq. 74. We will, once and for all need to calculate nan 1) inter-point distances each of which is an 0(d) calculation and place the results in an inter-point distance table. The space complexity is, then, O(n). Finding the minimum distance pair (for the first merging) requires that we step through the complete list, keeping the 40 CHAPTER 10. UNSUPERVISED LEARNING AND CLUSTERING index of the smallest distance. Thus for the first agglomerative step, the complexity is O(n(n 1)(+1)) = O(n-X). For an arbitrary agglomeration step (i.e., from a to - 1), we need merely step through the nin - 1) - 2 "umused" distances in the list and find the smallest for which x and x' lie in different clusters. This is, again, O(n(n-1) - 2). The full time complexity is thus (and), and in typical conditions MINIMUM ALGORITHM SINGLE- LINKACE ALGORITHM SPANNING TREE The Nearest-Neighbor Algorithm When druin is used to measure the distance between clusters (Eq. 74) the algorithm is sometimes called the nearest-neighbor cluster algorithm, or minimum algorithm Moreover, if it is terminated when the distance between nearest clusters exceeds an arbitrary threshold, it is called the single-linkage algorithm. Suppose that we think of the data points as being nodes of a graph, with edges forming a path between the nodes in the same subset D. When druin is used to measure the distance between subsets, the nearest neighbor nodes determine the nearest subsets. The merging of D and D; corresponds to adding an edge between the nearest pair of nodes in D: and D. Since edges linking clusters always go between distinct clusters, the resulting graph never has any closed loops or circuits in the terminology of graph theory, this procedure generates a tree. If it is allowed to continue until all of the subsets are linked, the result is a spanning tree-a tree with a path from any node to any other node. Moreover, it can be shown that the sum of the edge lengths of the resulting tree will not exceed the sum of the edge lengths for any other spanning tree for that set of samples (Problem 37). Thus, with the use of dmin as the distance measure, the agglomerative clustering procedure becomes an algorithm for generating a minimal spanning tree. Figure 10.12 shows the results of applying this procedure to Gaussian data. In both cases the procedure was stopped giving two large clusters (plus three singleton outliers); a minimal spanning tree can be obtained by adding the shortest possible edge between the two clusters. In the first case where the clusters are fairly well separated, the obvious clusters are found. In the second case, the presence of a point located so as to produce a bridge between the clusters results in a rather unexpected grouping into one large, elongated cluster, and one small, compact cluster. This behavior is often called the chaining effect," and is sometimes considered to be a defect of this distance measure. To the extent that the results are very sensitive to noise or to slight changes in position of the data points, this is certainly a valid criticism. MAXIMUM ALGORITHM COMPLETE LINKAGE ALGORITHM The Farthest-Neighbor Algorithm When dmax (Eq. 75) is used to measure the distance between subsets, the algorithm is sometimes called the farthest-neighbor clustering algorithm, or marimum algorithm. If it is terminated when the distance between nearest clusters exceeds an arbitrary threshold, it is called the complete-linkage algorithm. The farthest-neighbor algorithm discourages the growth of elongated clusters. Application of the procedure can be thought of as producing a graph in which edges connect all of the nodes in a cluster. In the terminology of graph theory, every cluster constitutes a complete subgraph. The distance between two clusters is determined by the most distant nodes in the two There are methods for sorting or arranging the entries in the inter-point distance table so as to easily avoid inspection of points in the same cluster, but these typically do not improve the complexity results significantly COMPLETE SUBGRAPH 10.9. HIERARCHICAL CLUSTERING 41 Lama Figure 10.12: Two Gaussians were used to generate two-dimensional samples, shown in pink and black. The nearest-neighbor clustering algorithm gives two clusters that well approximate the generating Gaussians (left). If, however, another particular sample is generated (red point at the right) and the procedure re-started, the clusters do not well approximate the Gaussians. This illustrates how the algorithm is sensitive to the details of the samples. clusters. When the nearest clusters are merged, the graph is changed by adding edges between every pair of nodes in the two clusters. If we define the diameter of a partition as the largest diameter for clusters in the partition, then each iteration increases the diameter of the partition as little as possible. As Fig. 10.13 illustrates, this is advantageous when the true clusters are compact and roughly equal in size. Nevertheless, when this is not the case happens with the two elongated clusters - the resulting groupings can be meaningless. This is another example of imposing structure on data rather than finding structure in it. Compromises The minimum and maximum measures represent two extremes in measuring the dis- tance between clusters. Like all procedures that involve minima or maxima, they tend to be overly sensitive to "outliers" or "wildshots." The use of averaging is an obvious way to ameliorate these problems, and daug and dear (Eqs. 76 & 77) are natural compromises between druir and draz. Computationally, dmeen is the simplest of all of these measures, since the others require computing all ning pairs of distances ||X X'||. However, a measure such as davy can be used when the distances ||X X'||| are replaced by similarity measures, where the similarity between mean vectors may be difficult or impossible to define
Step by Step Solution
There are 3 Steps involved in it

Get step-by-step solutions from verified subject matter experts