Answered step by step
Verified Expert Solution
Link Copied!

Question

1 Approved Answer

2. Create a dummy variable from 'endcap' and summarize your observations from the descriptive statistics of the variables. 3. Run correlations on the following variables:
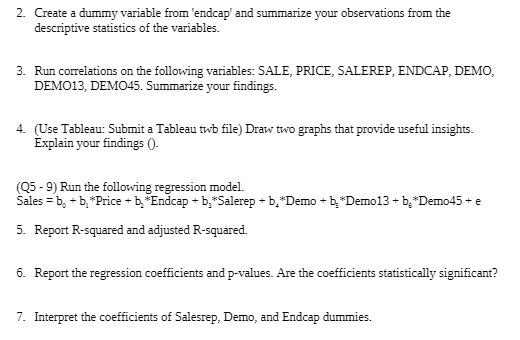
image text in transcribed
2. Create a dummy variable from 'endcap' and summarize your observations from the descriptive statistics of the variables. 3. Run correlations on the following variables: SALE, PRICE, SALEREP, ENDCAP, DEMO, DEMO13, DEMO45. Summarize your findings. 4. (Use Tableau: Submit a Tableau two file) Draw two graphs that provide useful insights. Explain your findings ()- (Q5 - 9) Run the following regression model. Sales = b. + b, *Price + b, *Endcap + b,*Salerep + b,*Demo + b*Demo13 + b*Demo45 + e 5. Report R-squared and adjusted R-squared. 6. Report the regression coefficients and p-values. Are the coefficients statistically significant? 7. Interpret the coefficients of Salesrep, Demo, and Endcap dummies

Step by Step Solution

There are 3 Steps involved in it

Step: 1

blur-text-image

Get Instant Access to Expert-Tailored Solutions

See step-by-step solutions with expert insights and AI powered tools for academic success

Step: 2

blur-text-image_2

Step: 3

blur-text-image_3

Ace Your Homework with AI

Get the answers you need in no time with our AI-driven, step-by-step assistance

Get Started

Recommended Textbook for

Business research methods

Authors: William G Zikmund, Barry J. Babin, Jon C. Carr, Mitch Griff

8th Edition

978-032432062, 0324320620, 1439080674, 978-1439080672

More Books

Students also viewed these Marketing questions

Question

Which are most liquid, non-current assets or current assets?

Answered: 1 week ago