Answered step by step
Verified Expert Solution
Link Copied!

Question

1 Approved Answer

2. Create a line graph of the function f(x)=1ex for x=0 to 4 with increment 0.1 3. Import the text file hurricane.txt into Excel and
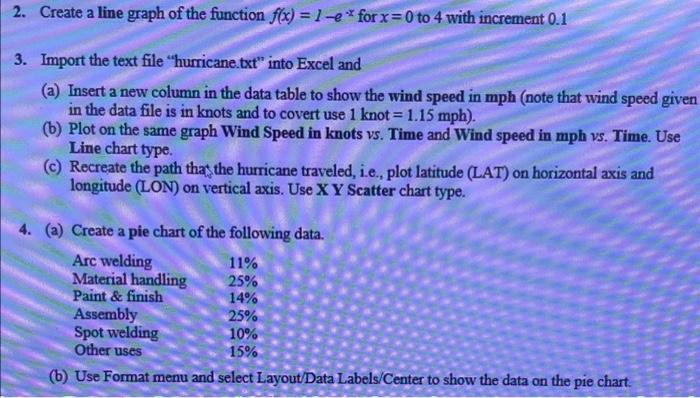
image text in transcribed
2. Create a line graph of the function f(x)=1ex for x=0 to 4 with increment 0.1 3. Import the text file "hurricane.txt" into Excel and (a) Insert a new column in the data table to show the wind speed in mph (note that wind speed given in the data file is in knots and to covert use 1knot=1.15mph ). (b) Plot on the same graph Wind Speed in knots v. Time and Wind speed in mph v. Time. Use Line chart type. (c) Recreate the path that the hurricane traveled, i.e., plot latitude (LAT) on horizontal axis and longitude (LON) on vertical axis. Use X Y Scatter chart type. 4. (a) Create a pie chart of the following data. (b) Use Format menu and select Layout/Data Labels/Center to show the data on the pie chart

Step by Step Solution

There are 3 Steps involved in it

Step: 1

blur-text-image

Get Instant Access to Expert-Tailored Solutions

See step-by-step solutions with expert insights and AI powered tools for academic success

Step: 2

blur-text-image

Step: 3

blur-text-image

Ace Your Homework with AI

Get the answers you need in no time with our AI-driven, step-by-step assistance

Get Started

Students also viewed these Databases questions