Answered step by step
Verified Expert Solution
Link Copied!

Question

1 Approved Answer

2.) Create a velocity vs time graph and an acceleration vs time graph for the motion of the ball from when it starts at rest
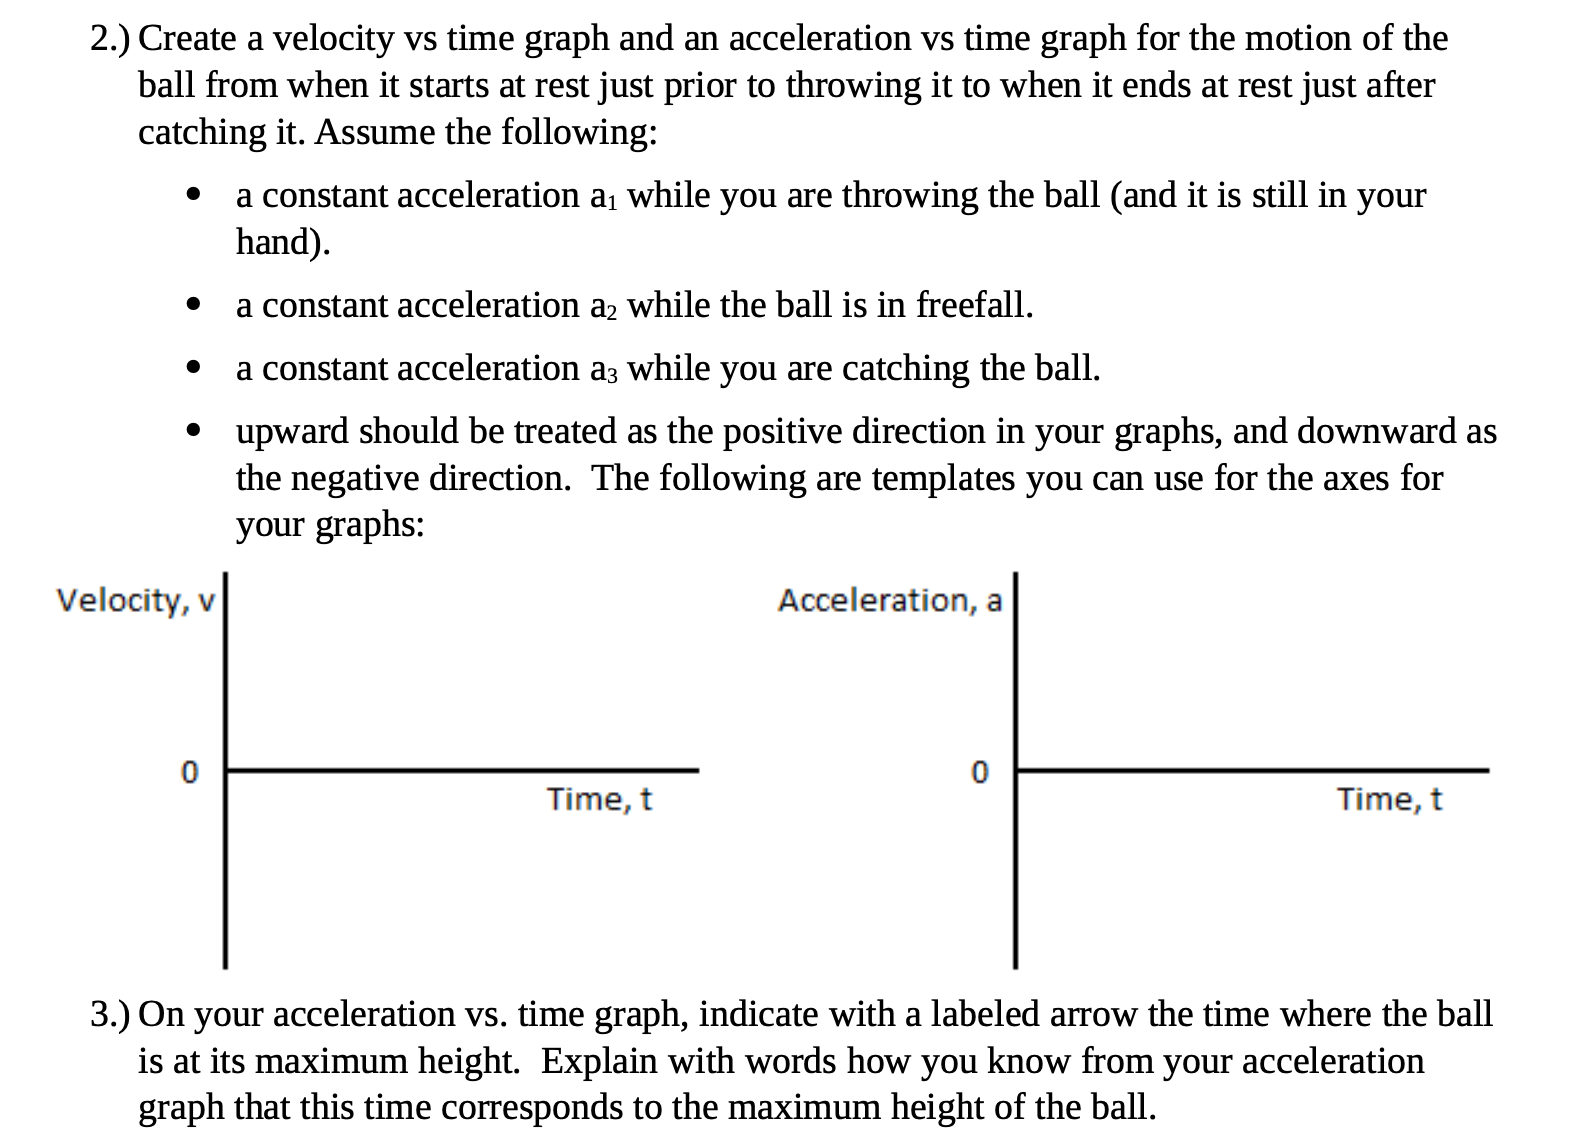
image text in transcribed
2.) Create a velocity vs time graph and an acceleration vs time graph for the motion of the ball from when it starts at rest just prior to throwing it to when it ends at rest just after catching it. Assume the following: 0 a constant acceleration a1 while you are throwing the ball (and it is still in your hand). 0 a constant acceleration a2 while the ball is in freefall. 0 a constant acceleration a3 while you are catching the ball. 0 upward should be treated as the positive direction in your graphs, and downward as the negative direction. The following are templates you can use for the axes for your graphs: Velocity, v Acceleration, a \"mat \"met 3.) On your acceleration vs. time graph, indicate with a labeled arrow the time where the ball is at its maximum height. Explain with words how you know from your acceleration graph that this time corresponds to the maximum height of the ball

Step by Step Solution

There are 3 Steps involved in it

Step: 1

blur-text-image

Get Instant Access to Expert-Tailored Solutions

See step-by-step solutions with expert insights and AI powered tools for academic success

Step: 2

blur-text-image

Step: 3

blur-text-image

Ace Your Homework with AI

Get the answers you need in no time with our AI-driven, step-by-step assistance

Get Started

Recommended Textbook for

Applied Physics

Authors: Dale ewen, Neill schurter, P. erik gundersen

10th Edition

978-0136116332, 136116337, 9780132830096, 978-0132109277

More Books

Students also viewed these Physics questions

Question

LO3.1 Characterize and give examples of markets.

Answered: 1 week ago