

Answered step by step
Verified Expert Solution
Question
1 Approved Answer
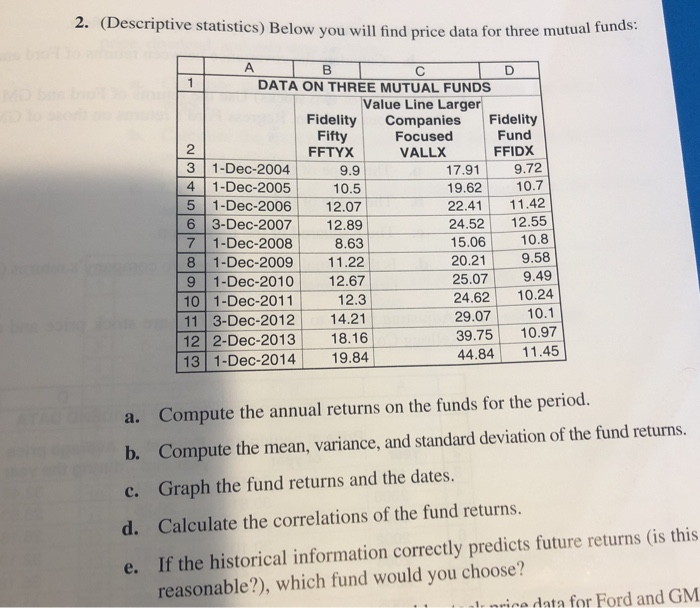
2. (Descriptive statistics) Below you will find price data for three mutual TD LA DATA ON THREE MUTUAL FUNDS Value Line Larger Fidelity Companies Fidelity
Step by Step Solution
There are 3 Steps involved in it
Step: 1

Get Instant Access to Expert-Tailored Solutions
See step-by-step solutions with expert insights and AI powered tools for academic success
Step: 2

Step: 3
Ace Your Homework with AI
Get the answers you need in no time with our AI-driven, step-by-step assistance
Get Started
Understanding financial statements
Authors: Lyn M. Fraser, Aileen Ormiston
9th Edition
136086241, 978-0136086246