Answered step by step
Verified Expert Solution
Link Copied!

Question

1 Approved Answer

2. Determine the graphical display tool (E.g., Interaction Effects Chart , Scatter Chart , etc. ) that you would use to present the results of
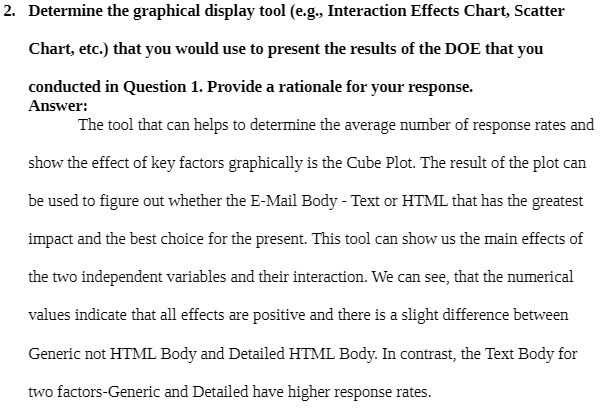
image text in transcribed
2. Determine the graphical display tool (E.g., Interaction Effects Chart , Scatter Chart , etc. ) that you would use to present the results of the DOE that you conducted in Question 1 . Provide a rationale for Your YESPOISE . Answer ! The tool that can helps to determine the average number of response rates and show the Effect of key factors graphically is the Cube Plot . The result of the plot can be used to figure out whether the E - Mail Body - Text or HIMIL that has the greatest impact and the best Choice for the present . This tool can show us the main Effects of the two independent variables and their interaction . WE can SEE , that the numerical values indicate that all Effects are positive and there is a slight difference between GENETIC not HIMIL Body and Detailed HIMIL Body . In contrast , the Text Body for two factors - Generic and Detailed have higher RESPONSE TALES

Step by Step Solution

There are 3 Steps involved in it

Step: 1

blur-text-image

Get Instant Access to Expert-Tailored Solutions

See step-by-step solutions with expert insights and AI powered tools for academic success

Step: 2

blur-text-image

Step: 3

blur-text-image

Ace Your Homework with AI

Get the answers you need in no time with our AI-driven, step-by-step assistance

Get Started

Recommended Textbook for

Introduction to Probability

Authors: Mark Daniel Ward, Ellen Gundlach

1st edition

716771098, 978-1319060893, 1319060897, 978-0716771098

More Books

Students also viewed these Mathematics questions