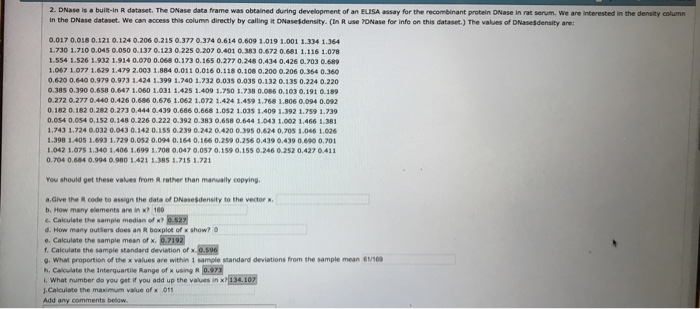
2. DNase is a built-In R dataset. The DNase data frame was obtained during development of an ELISA assay for the recombinant protein DNase in rat serum. We are interested in the density column in the DNase dataset. We can access this column directly by calling it ONasesdensity. (In R use 70Nase for info on this dataset.) The values of 0.017 0.018 0.121 0.124 0.206 0.215 0.377 0.374 0.614 0.609 1019 1.001 1.334 1.364 1.730 1.710 0.045 0.0s0 0.137 0.123 0.225 0.207 0.401 0.383 0.672 0.681 1.116 1.078 1-554 1.526 1.932 1.914 0.070 0.068 0.173 0.165 0.277 0.248 0.434 0.426 0.703 0.689 1.067 1.077 1.629 1.479 2.003 1.884 0.011 0.016 0.118 0.108 0.200 0.206 0.364 0.360 0.620 0.640 0.979 0.973 1.424 1.399 1.740 1.732 0.035 0.035 0.132 0.135 0.224 0.220 0.385 0.390 0.658 0.647 1.060 1.031 1.425 1.409 1.750 1.738 0.272 0.277 0.440 0.426 0.686 0.676 1.062 1.072 1.424 1.459 1.768 1.806 0.094 0.092 0.182 0.182 0.282 0.273 0.444 0.439 0.686 0.668 1.052 1.035 1 409 1.392 1.759 1.739 0.054 0.054 0.152 0.148 0.226 0.222 0.392 0.383 0.658 0.644 1.043 1.002 1.466 1.381 1.743 1.724 0.032 0.043 0.142 0.155 0.239 0.242 0.420 0.395 0.624 0,705 1.046 1.026 398 1.405 1693 1.729 0.052 0.094 0.164 0.166 0.259 0.256 0.439 0.439 0.690 0,701 042 1.075 1.340 3.406 1.699 1.708 0.047 0.057 0.159 0.155 0.246 0.252 0.427 0.411 0.704 0.684 0.994 0.980 1.421 1-385 1.715 1.721 0.086 0.103 0.191 0189 You should get these values from R rather than manually copying aGive the R code to assign the data of DNasesdensity to the vector b. How many elements are in x? 100 e. Calculate the sample media., or x? d. How many outlers does an R boxplot of x show? C e. Calculate the sample mean of x. 7192 Calculate the sample standard deviation of 0.$96 g. What proportion of the x values are within 1 sample standard deviations from the sample mean 616 h. Calculate the Interquartile Range of x using R 0.973 I. What number do you get if you add up the values in x J.Calculate the maximum value of x 011 Add any