Answered step by step
Verified Expert Solution
Link Copied!

Question

1 Approved Answer

2 Ensure the Sales Data worksheet is active, then use the FREQUENCY function to calculate the frequency distribution of the square footage of homes located
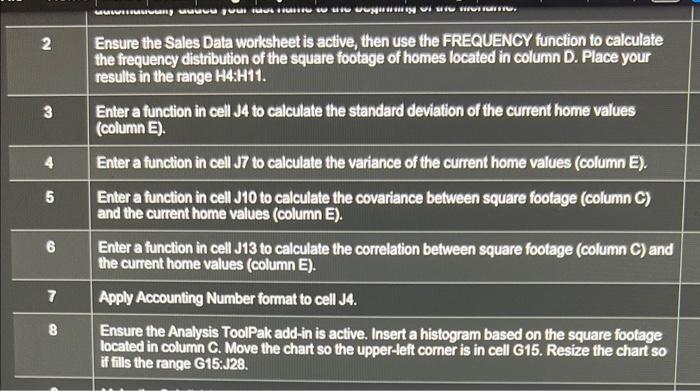
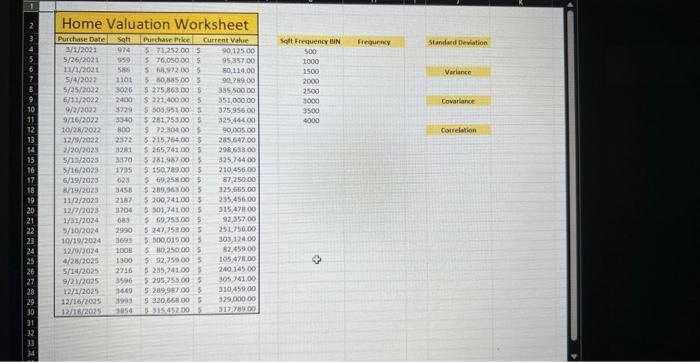
image text in transcribed
2 Ensure the Sales Data worksheet is active, then use the FREQUENCY function to calculate the frequency distribution of the square footage of homes located in column D. Place your results in the range H4:H11. Enter a function in cell J4 to calculate the standard deviation of the current home values (column E). Enter a function in cell J7 to calculate the variance of the current home values (column E). Enter a function in cell J10 to calculate the covariance between square footage (column C) and the current home values (column E). Enter a function in cell J13 to calculate the correlation between square footage (column C) and the current home values (column E). Apply Accounting Number format to cell J4. Ensure the Analysis ToolPak add-in is active. Insert a histogram based on the square footage located in column C. Move the chart so the upper-left comer is in cell G15. Resize the chart so if fills the range G15:J28. 2 Ensure the Sales Data worksheet is active, then use the FREQUENCY function to calculate the frequency distribution of the square footage of homes located in column D. Place your results in the range H4:H11. Enter a function in cell J4 to calculate the standard deviation of the current home values (column E). Enter a function in cell J7 to calculate the variance of the current home values (column E). Enter a function in cell J10 to calculate the covariance between square footage (column C) and the current home values (column E). Enter a function in cell J13 to calculate the correlation between square footage (column C) and the current home values (column E). Apply Accounting Number format to cell J4. Ensure the Analysis ToolPak add-in is active. Insert a histogram based on the square footage located in column C. Move the chart so the upper-left comer is in cell G15. Resize the chart so if fills the range G15:J28

Step by Step Solution

There are 3 Steps involved in it

Step: 1

blur-text-image

Get Instant Access to Expert-Tailored Solutions

See step-by-step solutions with expert insights and AI powered tools for academic success

Step: 2

blur-text-image_2

Step: 3

blur-text-image_3

Ace Your Homework with AI

Get the answers you need in no time with our AI-driven, step-by-step assistance

Get Started

Recommended Textbook for

SEO Competitor Audit Journal

Authors: Nelz Plummer

1st Edition

B09DDWJGRC, 979-8459748123

More Books

Students also viewed these Accounting questions

Question

Describe three other types of visual aids.

Answered: 1 week ago