

Answered step by step
Verified Expert Solution
Question
1 Approved Answer
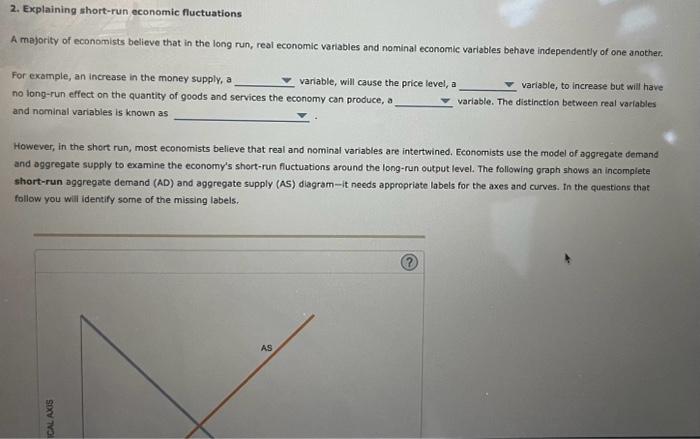
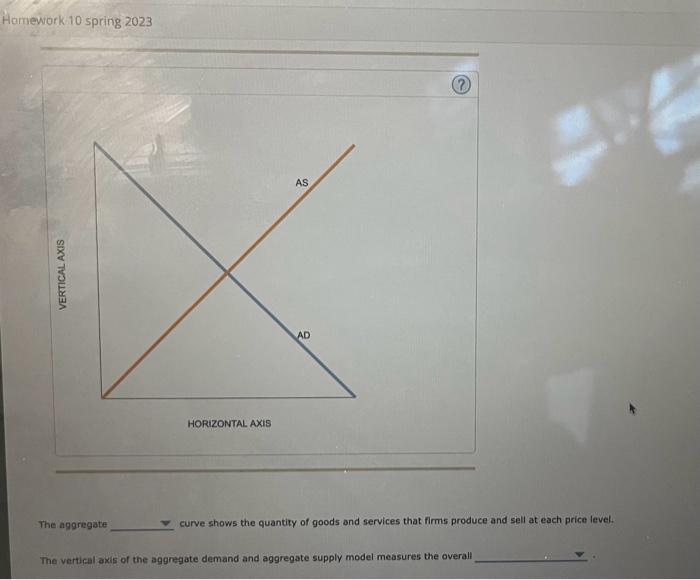
2. Explaining short-run economic fuctuations A majority of economists believe that in the long run, real economic variables and nominal economic variables behave independently of
Step by Step Solution
There are 3 Steps involved in it
Step: 1

Get Instant Access to Expert-Tailored Solutions
See step-by-step solutions with expert insights and AI powered tools for academic success
Step: 2

Step: 3
Ace Your Homework with AI
Get the answers you need in no time with our AI-driven, step-by-step assistance
Get Started
Principles Of Managerial Accounting
Authors: James M. Reeve
1st Edition
0324640625, 978-0324640625