Answered step by step
Verified Expert Solution
Link Copied!

Question

1 Approved Answer

2. FIGURE Q2a shows the rates of change in sales of companies A, B, C, D and E for 1 hour between 9 am to
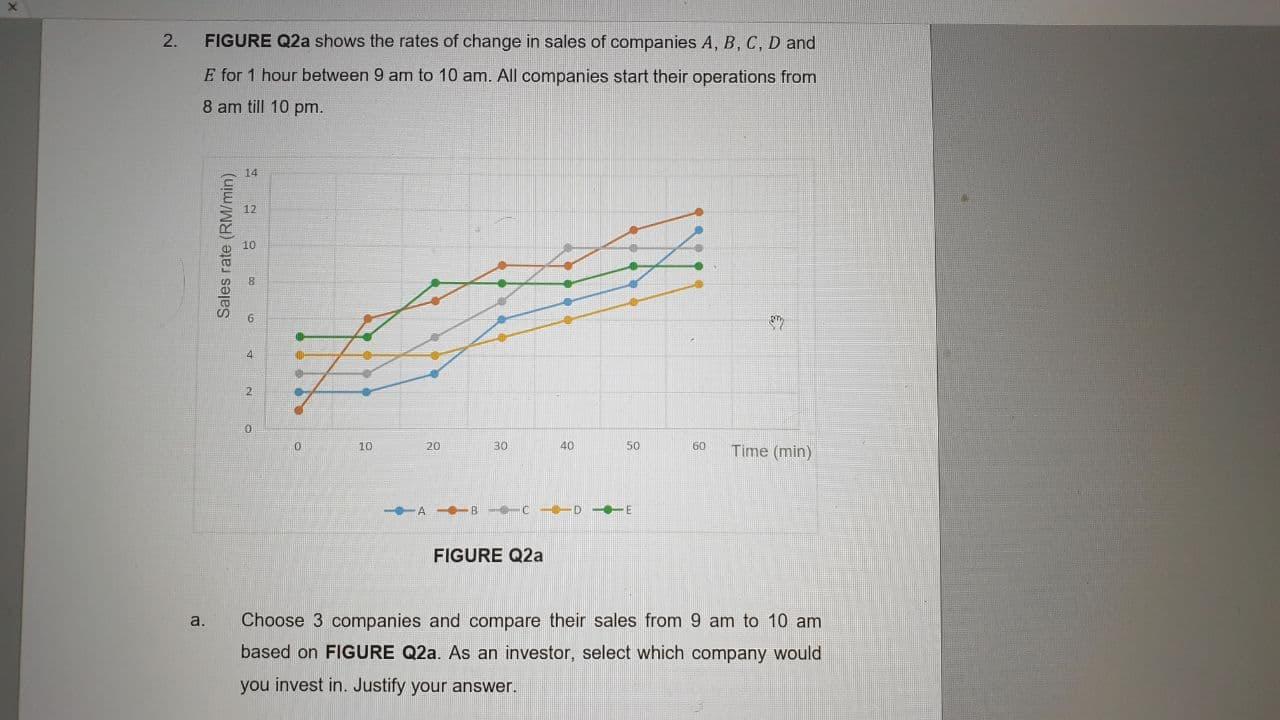
image text in transcribed

2. FIGURE Q2a shows the rates of change in sales of companies A, B, C, D and E for 1 hour between 9 am to 10 am. All companies start their operations from 8 am till 10 pm. 14 Sales rate (RM/min) 6 4 2 0 0 10 20 30 40 50 60 Time (min) -A-B-C-D-E FIGURE Q2a a. Choose 3 companies and compare their sales from 9 am to 10 am based on FIGURE Q2a. As an investor, select which company would you invest in. Justify your answer. 2. FIGURE Q2a shows the rates of change in sales of companies A, B, C, D and E for 1 hour between 9 am to 10 am. All companies start their operations from 8 am till 10 pm. 14 Sales rate (RM/min) 6 4 2 0 0 10 20 30 40 50 60 Time (min) -A-B-C-D-E FIGURE Q2a a. Choose 3 companies and compare their sales from 9 am to 10 am based on FIGURE Q2a. As an investor, select which company would you invest in. Justify your

Step by Step Solution

There are 3 Steps involved in it

Step: 1

blur-text-image

Get Instant Access to Expert-Tailored Solutions

See step-by-step solutions with expert insights and AI powered tools for academic success

Step: 2

blur-text-image_2

Step: 3

blur-text-image_3

Ace Your Homework with AI

Get the answers you need in no time with our AI-driven, step-by-step assistance

Get Started

Recommended Textbook for

Trading For Beginners 25 Secrets To Trade For A Living

Authors: Mark Bresett

1st Edition

1521327742, 978-1521327746

More Books

Students also viewed these Finance questions

Question

What causes stock prices to rise and fall?

Answered: 1 week ago