Answered step by step
Verified Expert Solution
Question
1 Approved Answer
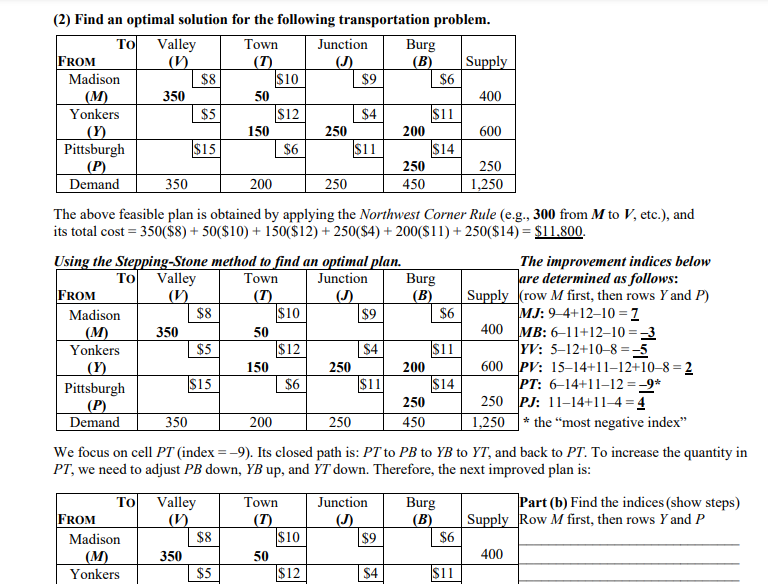
(2) Find an optimal solution for the following transportation problem. The above feasible plan is obtained by applying the Northwest Corner Rule (e.g., 300 from


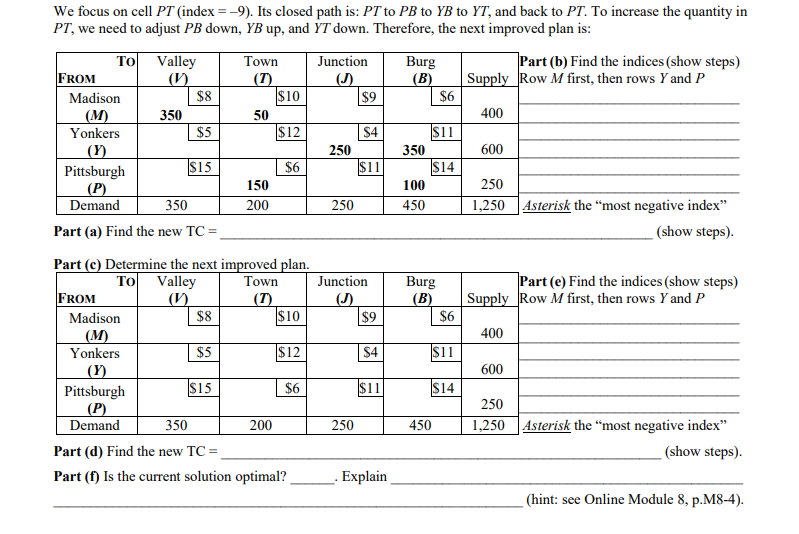
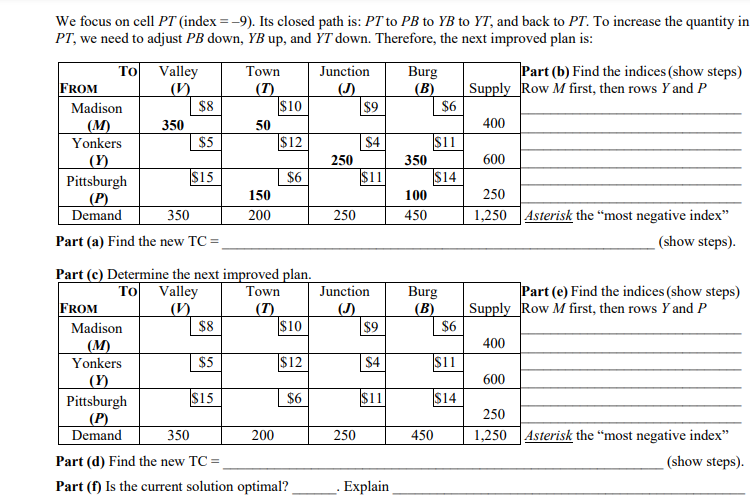
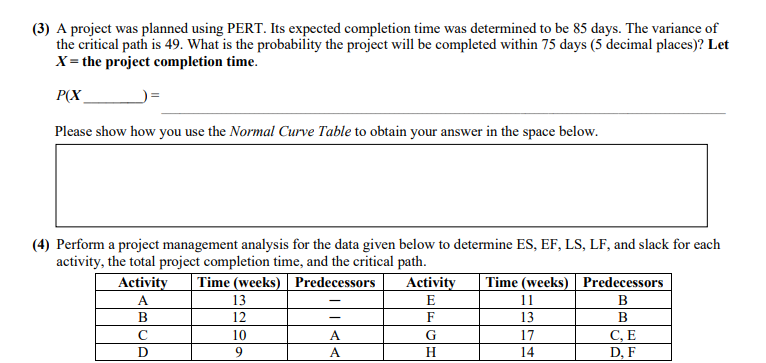
 (2) Find an optimal solution for the following transportation problem. The above feasible plan is obtained by applying the Northwest Corner Rule (e.g., 300 from M to V, etc.), and its total cost =350($8)+50($10)+150($12)+250($4)+200($11)+250($14)=$11.800. Ileina tho Stonnina_-Stamo mothad tn find an antimal nlan The improvement indices below are determined as follows: (row M first, then rows Y and P ) MJ:94+1210=7MB:611+1210=3YV:512+108=5PV:1514+1112+108=2PT:614+1112=9PJ:1114+114=4*the"mostnegativeindex" We focus on cell PT (index =-9). Its closed path is: PT to PB to YB to YT, and back to PT. To increase the quantity in PT, we need to adjust PB down, YB up, and YT down. Therefore, the next improved plan is: We focus on cell PT (index =-9). Its closed path is: PT to PB to YB to YT, and back to PT. To increase the quantity in PT, we need to adjust PB down, YB up, and YT down. Therefore, the next improved plan is: Part (a) Find the new 1C= (show steps). Dart (a) Natarmina tha navt immenstad nlan Part (d) Find the new TC = (show steps). Part (f) Is the current solution optimal? . Explain (hint: see Online Module 8, p.M8-4). We focus on cell PT (index =9 ). Its closed path is: PT to PB to YB to YT, and back to PT. To increase the quantity in PT, we need to adjust PB down, YB up, and YT down. Therefore, the next improved plan is: Part (a) Find the new TC= (show steps). Dart (e) Netermine the nevt imnreved nlan Part (d) Find the new TC= (show steps). Part (f) Is the current solution optimal? . Explain 3) A project was planned using PERT. Its expected completion time was determined to be 85 days. The variance of the critical path is 49 . What is the probability the project will be completed within 75 days ( 5 decimal places)? Let X= the project completion time. P(X)= Please show how you use the Normal Curve Table to obtain your answer in the space below. (4) Perform a project management analysis for the data given below to determine ES, EF, LS, LF, and slack for each activity, the total project completion time, and the critical path. (2) Find an optimal solution for the following transportation problem. The above feasible plan is obtained by applying the Northwest Corner Rule (e.g., 300 from M to V, etc.), and its total cost =350($8)+50($10)+150($12)+250($4)+200($11)+250($14)=$11.800. Ileina tho Stonnina_-Stamo mothad tn find an antimal nlan The improvement indices below are determined as follows: (row M first, then rows Y and P ) MJ:94+1210=7MB:611+1210=3YV:512+108=5PV:1514+1112+108=2PT:614+1112=9PJ:1114+114=4*the"mostnegativeindex" We focus on cell PT (index =-9). Its closed path is: PT to PB to YB to YT, and back to PT. To increase the quantity in PT, we need to adjust PB down, YB up, and YT down. Therefore, the next improved plan is: We focus on cell PT (index =-9). Its closed path is: PT to PB to YB to YT, and back to PT. To increase the quantity in PT, we need to adjust PB down, YB up, and YT down. Therefore, the next improved plan is: Part (a) Find the new 1C= (show steps). Dart (a) Natarmina tha navt immenstad nlan Part (d) Find the new TC = (show steps). Part (f) Is the current solution optimal? . Explain (hint: see Online Module 8, p.M8-4). We focus on cell PT (index =9 ). Its closed path is: PT to PB to YB to YT, and back to PT. To increase the quantity in PT, we need to adjust PB down, YB up, and YT down. Therefore, the next improved plan is: Part (a) Find the new TC= (show steps). Dart (e) Netermine the nevt imnreved nlan Part (d) Find the new TC= (show steps). Part (f) Is the current solution optimal? . Explain 3) A project was planned using PERT. Its expected completion time was determined to be 85 days. The variance of the critical path is 49 . What is the probability the project will be completed within 75 days ( 5 decimal places)? Let X= the project completion time. P(X)= Please show how you use the Normal Curve Table to obtain your answer in the space below. (4) Perform a project management analysis for the data given below to determine ES, EF, LS, LF, and slack for each activity, the total project completion time, and the critical path
 Step by Step Solution
There are 3 Steps involved in it
Step: 1

Get Instant Access to Expert-Tailored Solutions
See step-by-step solutions with expert insights and AI powered tools for academic success
Step: 2

Step: 3

Ace Your Homework with AI
Get the answers you need in no time with our AI-driven, step-by-step assistance
Get Started


