Answered step by step
Verified Expert Solution
Question
1 Approved Answer
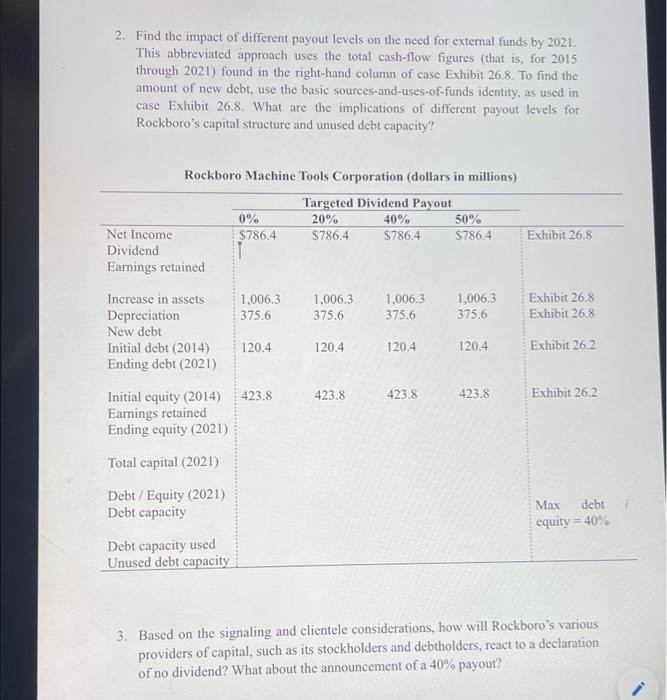
2. Find the impact of different payout levels on the need for external funds by 2021. This abbreviated approach uses the total cash-flow figures


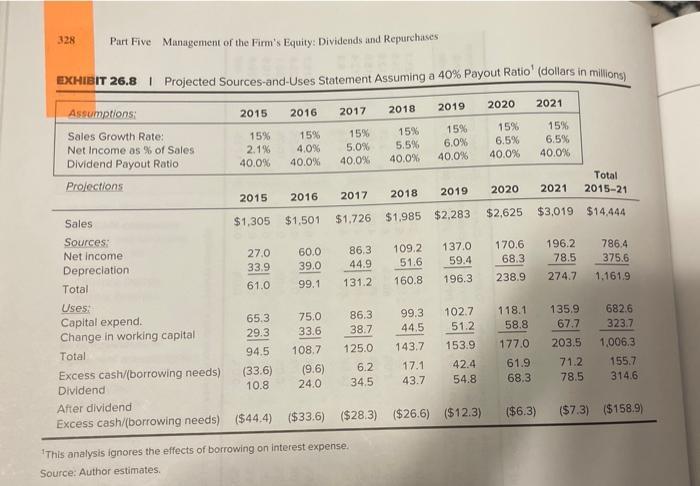
2. Find the impact of different payout levels on the need for external funds by 2021. This abbreviated approach uses the total cash-flow figures (that is, for 2015 through 2021) found in the right-hand column of case Exhibit 26.8. To find the amount of new debt, use the basic sources-and-uses-of-funds identity, as used in case Exhibit 26.8. What are the implications of different payout levels for Rockboro's capital structure and unused debt capacity? Rockboro Machine Tools Corporation (dollars in millions) Targeted Dividend Payout 20% $786.4 Net Income Dividend Earnings retained Increase in assets Depreciation New debt Initial debt (2014) Ending debt (2021) 0% $786.4 Debt capacity used Unused debt capacity 1,006.3 375.6 120.4 Initial equity (2014) 423.8 Earnings retained Ending equity (2021) Total capital (2021) Debt / Equity (2021) Debt capacity 1,006.3 375.6 120.4 423.8 40% $786.4 1,006.3 375.6 120.4 423.8 50% $786.4 1,006.3 375.6 120.4 423.8 Exhibit 26.8 Exhibit 26.8 Exhibit 26.8 Exhibit 26.2. Exhibit 26.2 Max debt equity = 40% 3. Based on the signaling and clientele considerations, how will Rockboro's various providers of capital, such as its stockholders and debtholders, react to a declaration of no dividend? What about the announcement of a 40% payout? 328 Part Five Management of the Firm's Equity: Dividends and Repurchases EXHIBIT 26.8 | Projected Sources-and-Uses Statement Assuming a 40% Payout Ratio' (dollars in millions) 2019 2020 2021 15% 6.0% 40.0% Assumptions: Sales Growth Rate: Net Income as % of Sales Dividend Payout Ratio Projections Sales Sources: Net income Depreciation. Total Uses: Capital expend. Change in working capital Total Excess cash/(borrowing needs) Dividend After dividend Excess cash/(borrowing needs) 2015 15% 2.1% 40.0% 27.0 33.9 61.0 2016 2017 15% 15% 4.0% 5.0% 40.0% 40.0% 65.3 29.3 94.5 (33.6) 10.8 2015 2016 2018 2017 2019 $1,305 $1,501 $1,726 $1,985 $2,283 60.0 39.0 99.1 75.0 86.3 33.6 38.7 108.7 125.0 6.2 (9.6) 24.0 2018 86.31 109.2 137.0 44.9 51.6 59.4 131.2 160.8 196.3 15% 5.5% 40.0% 34.5 This analysis ignores the effects of borrowing on interest expense. Source: Author estimates. 99.3 44.5 143.7 17.1 43.7 102.7 42.4 54.8 ($44.4) ($33.6) ($28.3) ($26.6) ($12.3) 15% 6.5% 40.0% 118.1 51.2 58.8 153.9 177.0 61.9 68.3 2020 $2,625 15% 6.5% 40.0% 170.6 196.2 68.3 78.5 238.9 ($6.3) Total 2021 2015-21 $3,019 $14,444 786.4 375.6 274.7 1.161.9 135.9 67.7 203.5 71.2 78.5 682.6 323.7 1,006.3 155.7 314.6 ($7.3) ($158.9)
Step by Step Solution
★★★★★
3.47 Rating (173 Votes )
There are 3 Steps involved in it
Step: 1
2 If the dividend payout ratio were to increase to 50 Rockboro would need to borrow an additional 96...
Get Instant Access to Expert-Tailored Solutions
See step-by-step solutions with expert insights and AI powered tools for academic success
Step: 2

Step: 3

Ace Your Homework with AI
Get the answers you need in no time with our AI-driven, step-by-step assistance
Get Started


