Question
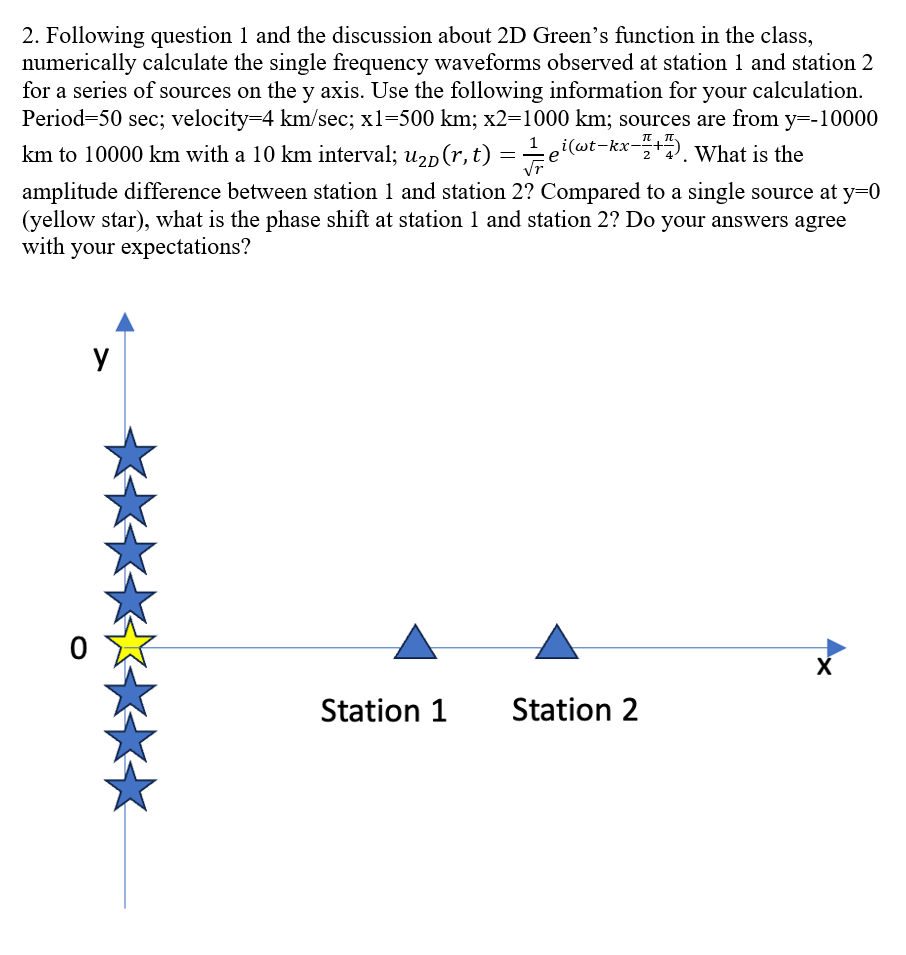
2. Following question 1 and the discussion about 2D Green's function in the class, numerically calculate the single frequency waveforms observed at station 1

2. Following question 1 and the discussion about 2D Green's function in the class, numerically calculate the single frequency waveforms observed at station 1 and station 2 for a series of sources on the y axis. Use the following information for your calculation. Period 50 sec; velocity=4 km/sec; x1=500 km; x2=1000 km; sources are from y=-10000 km to 10000 km with a 10 km interval; up (r,t) = 1 ei(wt-kx-+). What is the 2 amplitude difference between station 1 and station 2? Compared to a single source at y=0 (yellow star), what is the phase shift at station 1 and station 2? Do your answers agree with your expectations? y X Station 1 Station 2
Step by Step Solution
There are 3 Steps involved in it
Step: 1

Get Instant Access to Expert-Tailored Solutions
See step-by-step solutions with expert insights and AI powered tools for academic success
Step: 2

Step: 3

Ace Your Homework with AI
Get the answers you need in no time with our AI-driven, step-by-step assistance
Get StartedRecommended Textbook for
Quantitative Analysis For Management
Authors: Barry Render, Ralph M. Stair, Michael E. Hanna
11th Edition
9780132997621, 132149117, 132997622, 978-0132149112
Students also viewed these Physics questions
Question
Answered: 1 week ago
Question
Answered: 1 week ago
Question
Answered: 1 week ago
Question
Answered: 1 week ago
Question
Answered: 1 week ago
Question
Answered: 1 week ago
Question
Answered: 1 week ago
Question
Answered: 1 week ago
Question
Answered: 1 week ago
Question
Answered: 1 week ago
Question
Answered: 1 week ago
Question
Answered: 1 week ago
Question
Answered: 1 week ago
Question
Answered: 1 week ago
Question
Answered: 1 week ago
Question
Answered: 1 week ago
Question
Answered: 1 week ago
Question
Answered: 1 week ago
Question
Answered: 1 week ago
Question
Answered: 1 week ago
View Answer in SolutionInn App


